## Density Plot: Saliency Score Distribution for Llama-3-8B and Llama-3-70B
### Overview
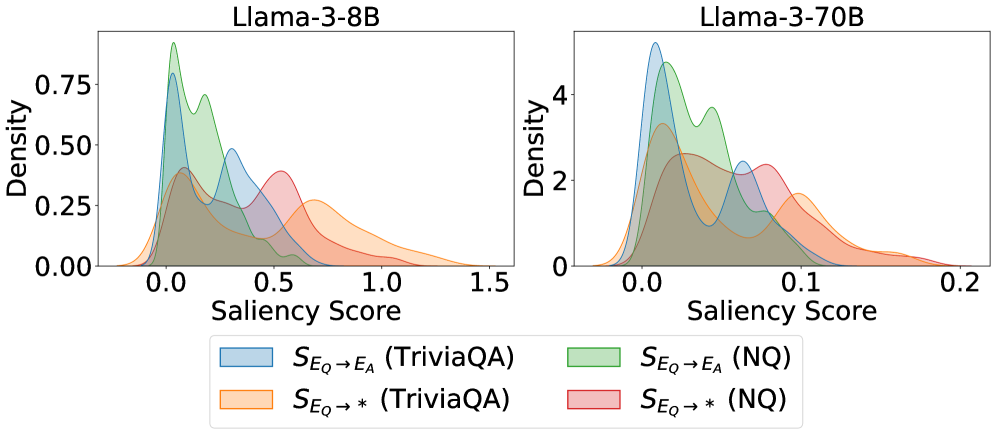
The image presents two density plots comparing the saliency score distributions for Llama-3-8B and Llama-3-70B models. Each plot shows the distribution of saliency scores for two different question-answering datasets (TriviaQA and NQ) and two different types of saliency scores (S<sub>Eq</sub>→E<sub>A</sub> and S<sub>Eq</sub>→*). The x-axis represents the saliency score, and the y-axis represents the density.
### Components/Axes
* **Titles:**
* Left Plot: Llama-3-8B
* Right Plot: Llama-3-70B
* **X-axis (Saliency Score):**
* Left Plot: Range from 0.0 to 1.5, with markers at 0.0, 0.5, 1.0, and 1.5.
* Right Plot: Range from 0.0 to 0.2, with markers at 0.0, 0.1, and 0.2.
* **Y-axis (Density):**
* Left Plot: Range from 0.00 to 0.75, with markers at 0.00, 0.25, 0.50, and 0.75.
* Right Plot: Range from 0 to 4, with markers at 0, 2, and 4.
* **Legend (located at the bottom):**
* Blue: S<sub>Eq</sub>→E<sub>A</sub> (TriviaQA)
* Green: S<sub>Eq</sub>→E<sub>A</sub> (NQ)
* Orange: S<sub>Eq</sub>→* (TriviaQA)
* Red: S<sub>Eq</sub>→* (NQ)
### Detailed Analysis
**Llama-3-8B (Left Plot):**
* **S<sub>Eq</sub>→E<sub>A</sub> (TriviaQA) - Blue:** The distribution peaks around 0.1, with a smaller peak around 0.5. The density gradually decreases after 0.5, extending to approximately 1.2.
* **S<sub>Eq</sub>→E<sub>A</sub> (NQ) - Green:** The distribution has a sharp peak near 0.0, followed by a smaller peak around 0.2. The density decreases significantly after 0.2, extending to approximately 0.8.
* **S<sub>Eq</sub>→* (TriviaQA) - Orange:** The distribution peaks around 0.6, with a long tail extending to approximately 1.5.
* **S<sub>Eq</sub>→* (NQ) - Red:** The distribution peaks around 0.4, with a tail extending to approximately 1.0.
**Llama-3-70B (Right Plot):**
* **S<sub>Eq</sub>→E<sub>A</sub> (TriviaQA) - Blue:** The distribution peaks around 0.02, with a smaller peak around 0.07. The density decreases after 0.07, extending to approximately 0.18.
* **S<sub>Eq</sub>→E<sub>A</sub> (NQ) - Green:** The distribution has a sharp peak near 0.0, followed by a smaller peak around 0.03. The density decreases significantly after 0.03, extending to approximately 0.1.
* **S<sub>Eq</sub>→* (TriviaQA) - Orange:** The distribution peaks around 0.1, with a tail extending to approximately 0.2.
* **S<sub>Eq</sub>→* (NQ) - Red:** The distribution peaks around 0.06, with a tail extending to approximately 0.15.
### Key Observations
* For both models, the S<sub>Eq</sub>→E<sub>A</sub> scores tend to be concentrated at lower saliency scores compared to S<sub>Eq</sub>→* scores.
* The Llama-3-70B model shows a more concentrated distribution of saliency scores compared to the Llama-3-8B model, with the x-axis scale being much smaller.
* The NQ dataset generally has lower saliency scores compared to the TriviaQA dataset for both models.
### Interpretation
The density plots illustrate the distribution of saliency scores for different configurations of Llama models and datasets. The shift in distributions between the 8B and 70B models suggests that model size influences the saliency scores. The difference between TriviaQA and NQ datasets indicates that the nature of the questions and answers affects the saliency scores. The distinction between S<sub>Eq</sub>→E<sub>A</sub> and S<sub>Eq</sub>→* suggests that the method of calculating saliency scores also plays a significant role. The data suggests that the Llama-3-70B model assigns lower saliency scores overall compared to the Llama-3-8B model, potentially indicating a more focused or refined attention mechanism.