## Scatter Plot: Model Performance Comparison (Generative Quality vs. Task Success Rate)
### Overview
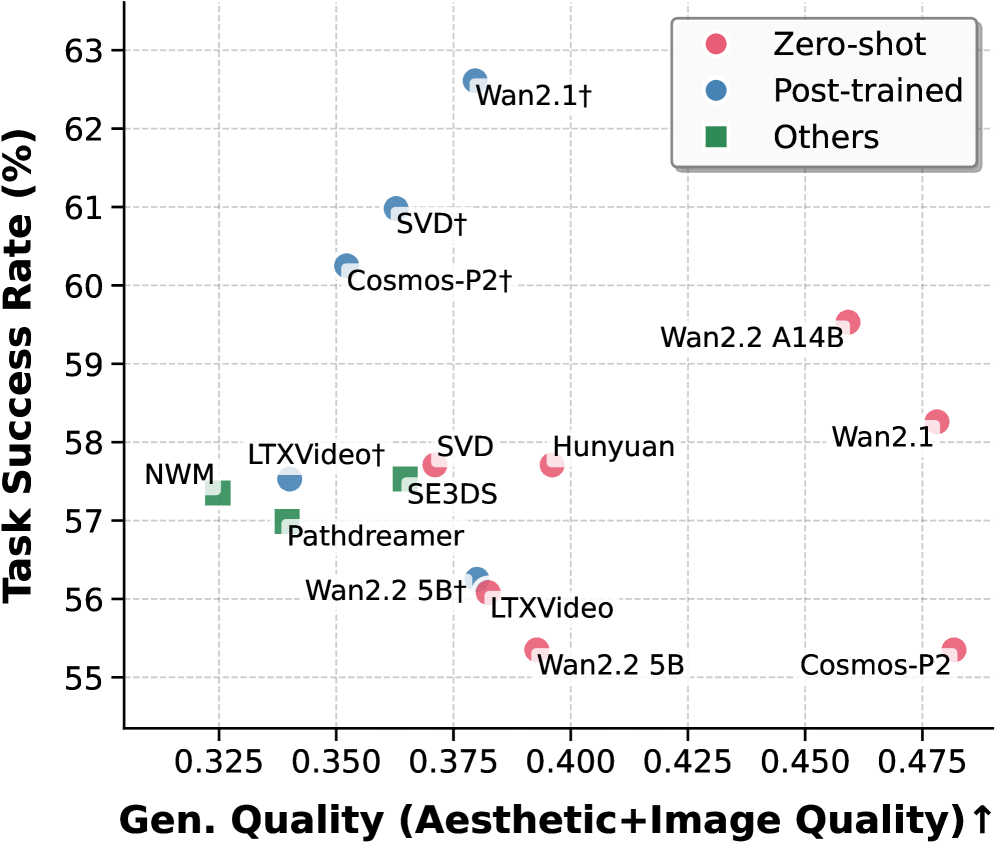
This image is a scatter plot comparing the performance of various AI models, likely for video or image generation tasks. It plots two key metrics against each other: "Gen. Quality (Aesthetic+Image Quality)" on the horizontal axis and "Task Success Rate (%)" on the vertical axis. Each data point represents a specific model, labeled with its name and categorized by its training paradigm (Zero-shot, Post-trained, or Others).
### Components/Axes
* **Chart Type:** Scatter Plot.
* **X-Axis:**
* **Label:** `Gen. Quality (Aesthetic+Image Quality)↑`
* **Scale:** Linear, ranging from approximately 0.325 to 0.475. The upward arrow (↑) indicates that higher values are better.
* **Major Ticks:** 0.325, 0.350, 0.375, 0.400, 0.425, 0.450, 0.475.
* **Y-Axis:**
* **Label:** `Task Success Rate (%)`
* **Scale:** Linear, ranging from 55% to 63%.
* **Major Ticks:** 55, 56, 57, 58, 59, 60, 61, 62, 63.
* **Legend:** Located in the top-right corner.
* **Pink Circle:** `Zero-shot`
* **Blue Circle:** `Post-trained`
* **Green Square:** `Others`
* **Data Points & Labels:** Each point is labeled with a model name. Some names are followed by a dagger symbol (†), which, based on their blue color, appears to denote a post-trained variant of a base model.
### Detailed Analysis
The plot contains 15 distinct data points. Below is a reconstruction of the data, with approximate coordinates read from the chart. The color/category is confirmed by cross-referencing with the legend.
| Model Name (Label) | Approx. Gen. Quality (X) | Approx. Task Success Rate (Y) | Color/Shape | Category (from Legend) |
| :--- | :--- | :--- | :--- | :--- |
| Wan2.1† | 0.380 | 62.5% | Blue Circle | Post-trained |
| SVD† | 0.365 | 61.0% | Blue Circle | Post-trained |
| Cosmos-P2† | 0.355 | 60.3% | Blue Circle | Post-trained |
| Wan2.2 A14B | 0.455 | 59.5% | Pink Circle | Zero-shot |
| Wan2.1 | 0.475 | 58.2% | Pink Circle | Zero-shot |
| Hunyuan | 0.400 | 57.7% | Pink Circle | Zero-shot |
| SVD | 0.375 | 57.7% | Pink Circle | Zero-shot |
| LTXVideo† | 0.340 | 57.5% | Blue Circle | Post-trained |
| SE3DS | 0.365 | 57.5% | Green Square | Others |
| NWM | 0.325 | 57.3% | Green Square | Others |
| Pathdreamer | 0.340 | 57.0% | Green Square | Others |
| Wan2.2 5B† | 0.380 | 56.3% | Blue Circle | Post-trained |
| LTXVideo | 0.385 | 56.0% | Pink Circle | Zero-shot |
| Wan2.2 5B | 0.395 | 55.3% | Pink Circle | Zero-shot |
| Cosmos-P2 | 0.475 | 55.3% | Pink Circle | Zero-shot |
**Trend Verification:**
* **Post-trained Models (Blue):** This series shows a general trend where higher generative quality correlates with higher task success rate. The line formed by points like LTXVideo†, SVD†, and Wan2.1† slopes upward from left to right.
* **Zero-shot Models (Pink):** This series is more dispersed. There is a cluster of models (Wan2.2 5B, LTXVideo, Cosmos-P2) with lower task success rates (~55-56%) but spanning a wide range of generative quality (0.385 to 0.475). Another cluster (Hunyuan, SVD, Wan2.1, Wan2.2 A14B) has higher task success (~57.7-59.5%) and also spans a wide quality range.
* **Others (Green):** These three models (NWM, Pathdreamer, SE3DS) are clustered in the lower-left quadrant, indicating relatively lower performance on both metrics compared to the top performers.
### Key Observations
1. **Top Performer:** `Wan2.1†` (Post-trained) achieves the highest Task Success Rate (~62.5%) with moderate Generative Quality (~0.380).
2. **Quality Leader:** `Wan2.1` and `Cosmos-P2` (both Zero-shot) tie for the highest Generative Quality (~0.475), but their Task Success Rates are among the lowest (~55.3% and ~58.2% respectively).
3. **Post-training Effect:** For several model families, the post-trained variant (†) significantly outperforms its zero-shot counterpart in Task Success Rate, often with a trade-off in Generative Quality.
* **Example:** `Wan2.1†` vs. `Wan2.1`: Task Success ↑ ~4.3%, Gen. Quality ↓ ~0.095.
* **Example:** `SVD†` vs. `SVD`: Task Success ↑ ~3.3%, Gen. Quality ↓ ~0.010.
4. **Model Family Spread:** The "Wan" model family (Wan2.1, Wan2.2 5B, Wan2.2 A14B) and its post-trained variants are represented across a wide area of the plot, showing significant performance variability based on size and training.
### Interpretation
This chart visualizes a fundamental trade-off in generative AI model development: **optimizing for aesthetic/image quality does not guarantee success on downstream tasks, and vice-versa.**
* **Post-training is highly effective for task performance.** The clear upward trend and superior positioning of the blue "Post-trained" points suggest that specialized fine-tuning is crucial for achieving high task success rates, even if it slightly reduces generic quality metrics.
* **Zero-shot models excel in raw quality.** The highest generative quality scores belong to zero-shot models, indicating these base models are excellent at producing visually pleasing outputs without task-specific tuning.
* **The "Others" category lags behind.** The green-square models occupy a lower-performance region, suggesting they may be older, smaller, or less specialized architectures compared to the Wan, SVD, and Cosmos families highlighted here.
* **Strategic Choice:** The data implies a strategic choice for practitioners: select a **post-trained model** (like Wan2.1†) for applications where task completion is critical, or select a high-quality **zero-shot model** (like Wan2.1) for applications where visual fidelity is the primary concern. The ideal model would be in the top-right corner, a goal not yet achieved by any model in this comparison.