## Scatter Plot: Task Success Rate vs. General Quality
### Overview
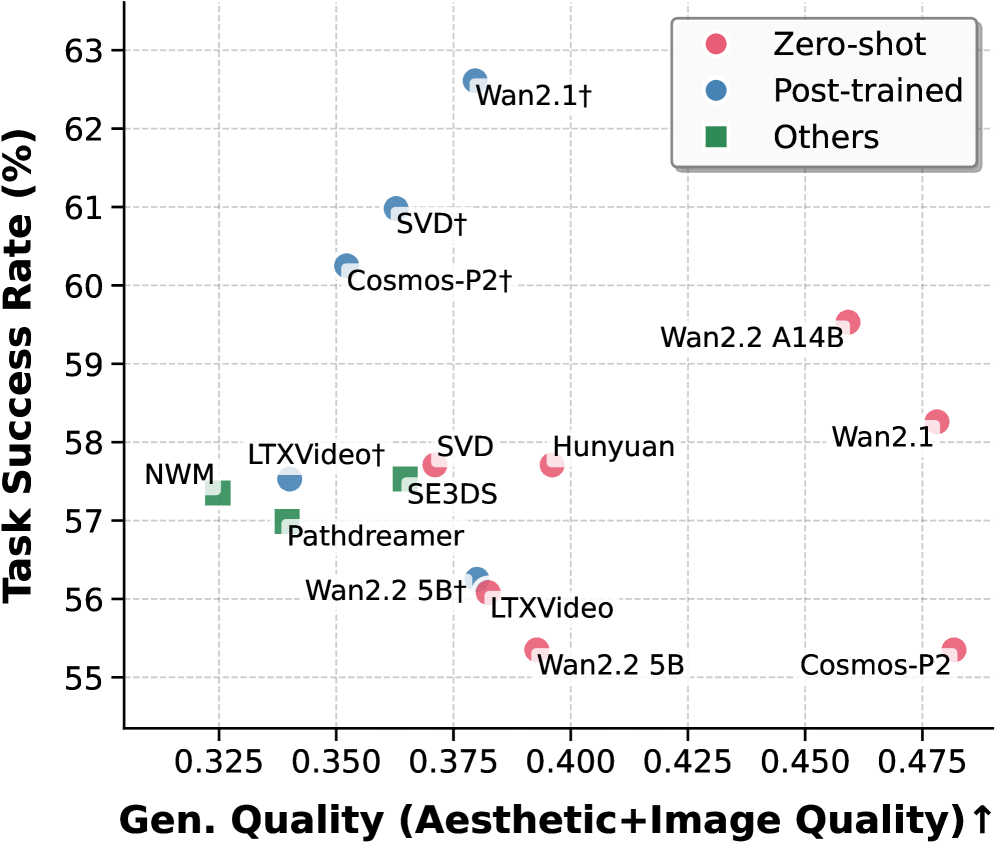
The image is a scatter plot comparing **Task Success Rate (%)** (y-axis) against **Gen. Quality (Aesthetic+Image Quality)** (x-axis). Data points are color-coded by model type: **Zero-shot** (red), **Post-trained** (blue), and **Others** (green). Labels for individual models are annotated near their respective points.
---
### Components/Axes
- **Y-axis (Task Success Rate)**: Ranges from 55% to 63% in 1% increments.
- **X-axis (Gen. Quality)**: Ranges from 0.325 to 0.475 in 0.025 increments.
- **Legend**: Located in the top-right corner, with three categories:
- **Zero-shot** (red circles)
- **Post-trained** (blue circles)
- **Others** (green squares)
- **Data Points**: Labeled with model names (e.g., "Wan2.1†", "SVD†", "Cosmos-P2†").
---
### Detailed Analysis
#### Zero-shot Models (Red)
- **Wan2.1†**: (0.475, 62.5%) – Highest task success rate and gen quality.
- **Wan2.2 A14B**: (0.45, 59%) – Moderate gen quality, mid-range success rate.
- **Wan2.2 5B**: (0.39, 55%) – Lower gen quality and success rate.
- **Cosmos-P2**: (0.475, 55%) – Highest gen quality but lowest success rate.
- **Hunyuan**: (0.40, 58%) – Mid-range gen quality and success rate.
- **SVD**: (0.38, 58%) – Lower gen quality, moderate success rate.
#### Post-trained Models (Blue)
- **SVD†**: (0.38, 61%) – High success rate, moderate gen quality.
- **Cosmos-P2†**: (0.36, 60%) – Moderate gen quality, high success rate.
- **LTXVideo†**: (0.35, 57.5%) – Lower gen quality, mid-range success rate.
- **Wan2.2 5B†**: (0.38, 56%) – Moderate gen quality, lower success rate.
#### Others (Green)
- **NWM**: (0.325, 57.5%) – Lowest gen quality, moderate success rate.
- **SE3DS**: (0.375, 57%) – Moderate gen quality, lower success rate.
- **Pathdreamer**: (0.35, 57%) – Moderate gen quality, lower success rate.
---
### Key Observations
1. **Wan2.1†** (Zero-shot) achieves the highest task success rate (62.5%) and gen quality (0.475), outperforming all other models.
2. **Cosmos-P2** (Zero-shot) has the highest gen quality (0.475) but the lowest task success rate (55%), suggesting a potential trade-off between quality and performance.
3. **Post-trained models** (blue) generally cluster in the mid-to-high range of both axes, indicating better balance between gen quality and task success.
4. **Others** (green) are concentrated in the lower-left quadrant, with lower gen quality and task success rates.
---
### Interpretation
- **Post-trained models** (blue) demonstrate a stronger correlation between gen quality and task success, suggesting that training improves performance consistency.
- **Zero-shot models** (red) show variability: while **Wan2.1†** excels, **Cosmos-P2** underperforms despite high gen quality, highlighting potential limitations in zero-shot generalization.
- **Others** (green) lag in both metrics, possibly due to less optimized training or architecture.
- The plot underscores the importance of post-training for balancing aesthetic quality and functional performance in generative models.