\n
## Scatter Plot: Confidence vs. Target Length (Elementary Mathematics)
### Overview
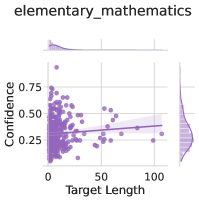
The image presents a scatter plot visualizing the relationship between "Target Length" and "Confidence" for the category "elementary_mathematics". A regression line with a shaded confidence interval is overlaid on the scatter points. The plot also includes marginal histograms at the top and right, showing the distributions of "Target Length" and "Confidence" respectively.
### Components/Axes
* **Title:** "elementary_mathematics" (top-left)
* **X-axis:** "Target Length" (ranging from approximately 0 to 100)
* **Y-axis:** "Confidence" (ranging from approximately 0.2 to 0.75)
* **Scatter Points:** Purple dots representing individual data points.
* **Regression Line:** A dark purple line representing the trend in the data.
* **Confidence Interval:** A light purple shaded area around the regression line.
* **Marginal Histogram (Top):** Displays the distribution of "Target Length".
* **Marginal Histogram (Right):** Displays the distribution of "Confidence".
### Detailed Analysis
The scatter plot shows a weak negative correlation between "Target Length" and "Confidence". As "Target Length" increases, "Confidence" tends to decrease slightly, but the relationship is not strong.
* **Scatter Plot Data:**
* The majority of points cluster between "Target Length" values of 0 and 50, with "Confidence" values ranging from approximately 0.25 to 0.7.
* There are fewer points with "Target Length" values greater than 50.
* The regression line has a slight negative slope.
* The confidence interval is relatively wide, indicating a high degree of uncertainty in the estimated relationship.
* **Marginal Histogram (Target Length):**
* The distribution of "Target Length" is heavily skewed to the right. There is a high concentration of values near 0, and a long tail extending towards higher values.
* The peak of the distribution is around a "Target Length" of approximately 5.
* **Marginal Histogram (Confidence):**
* The distribution of "Confidence" is skewed to the left. There is a concentration of values between 0.2 and 0.4, with a tail extending towards higher values.
* The peak of the distribution is around a "Confidence" of approximately 0.3.
### Key Observations
* The relationship between "Target Length" and "Confidence" is weak and potentially non-linear.
* The distributions of both "Target Length" and "Confidence" are non-normal.
* The wide confidence interval suggests that the regression line is not a precise predictor of "Confidence" given "Target Length".
* The marginal histograms reveal that the majority of data points have low "Target Length" and moderate "Confidence".
### Interpretation
The data suggests that, for elementary mathematics problems, longer target lengths do not necessarily lead to lower confidence, but the relationship is not strong. The weak correlation and wide confidence interval indicate that other factors likely play a more significant role in determining confidence levels. The skewed distributions suggest that the data may not be representative of all possible elementary mathematics problems. The concentration of data points with low "Target Length" could indicate that the model is being tested on simpler problems more frequently. The marginal histograms provide insight into the underlying distributions of the variables, which can be useful for understanding the characteristics of the data. The overall trend suggests a slight tendency for confidence to decrease with increasing target length, but this effect is small and may not be practically significant.