## Scatter Plots: Music Genre Distribution in Valid and Test Sets
### Overview
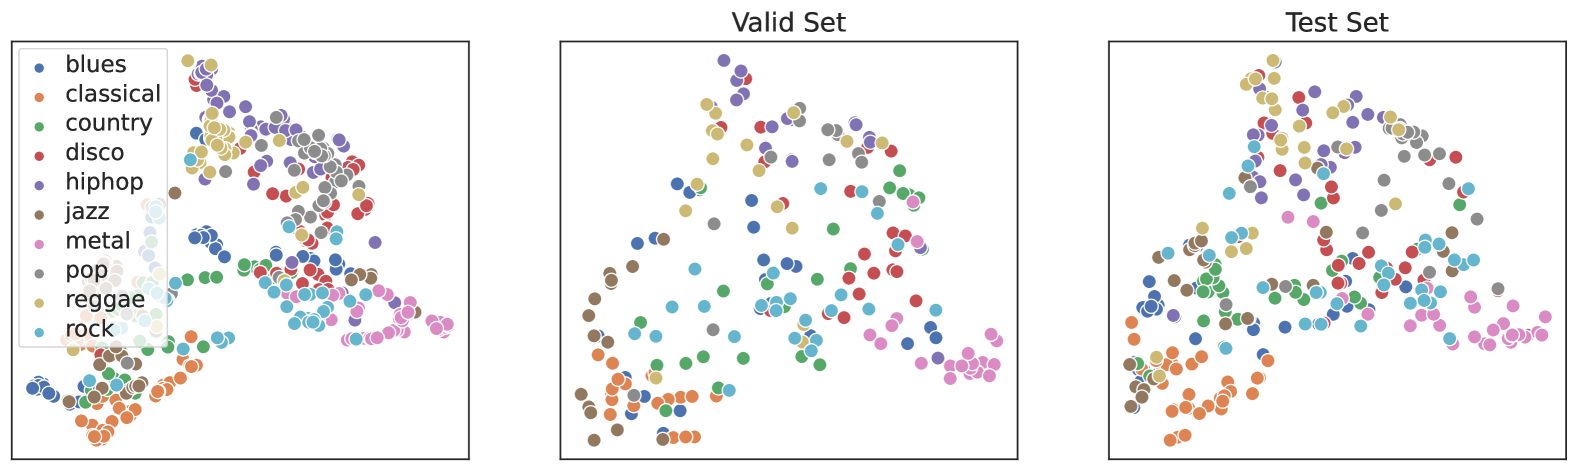
The image contains three scatter plots: a legend on the left and two main plots labeled "Valid Set" (middle) and "Test Set" (right). Each plot uses colored dots to represent 10 music genres, with positions indicating genre distribution patterns.
### Components/Axes
- **Legend**: Located in the top-left corner of the first plot. Maps 10 genres to colors:
- blues (blue), classical (orange), country (green), disco (red), hip-hop (purple), jazz (brown), metal (pink), pop (gray), reggae (yellow), rock (cyan).
- **Plots**:
- **Valid Set** (middle): Titled "Valid Set," with axes unlabeled but implied spatial distribution.
- **Test Set** (right): Titled "Test Set," with similar unlabeled axes.
- **Data Points**: Colored dots correspond to genres per the legend.
### Detailed Analysis
- **Valid Set**:
- **Blues** (blue): Clustered in the bottom-left quadrant.
- **Classical** (orange): Scattered near the bottom-left edge.
- **Country** (green): Spread across the middle region.
- **Disco** (red): Located in the top-right quadrant.
- **Hip-hop** (purple): Tight cluster in the top-left quadrant.
- **Jazz** (brown): Concentrated in the bottom-left quadrant.
- **Metal** (pink): Scattered in the top-right quadrant.
- **Pop** (gray): Distributed across the middle region.
- **Reggae** (yellow): Few dots in the bottom-right quadrant.
- **Rock** (cyan): Clustered in the top-right quadrant.
- **Test Set**:
- **Blues** (blue): Scattered in the bottom-left quadrant.
- **Classical** (orange): Dominant cluster in the bottom-left quadrant.
- **Country** (green): Spread across the middle region.
- **Disco** (red): Located in the top-right quadrant.
- **Hip-hop** (purple): Tight cluster in the top-left quadrant.
- **Jazz** (brown): Concentrated in the bottom-left quadrant.
- **Metal** (pink): Scattered in the top-right quadrant.
- **Pop** (gray): Distributed across the middle region.
- **Reggae** (yellow): Dominant cluster in the bottom-right quadrant.
- **Rock** (cyan): Clustered in the top-right quadrant.
### Key Observations
1. **Genre Separation**:
- Blues and classical show distinct clustering in the Test Set compared to the Valid Set.
- Hip-hop and jazz are tightly grouped in both sets, suggesting similar feature distributions.
- Reggae appears more concentrated in the Test Set’s bottom-right quadrant.
2. **Overlap**:
- Pop and country genres are widely distributed in both sets, indicating less distinct separations.
- Disco and metal share the top-right quadrant in both sets.
3. **Positioning**:
- Blues (blue) and jazz (brown) consistently occupy the bottom-left quadrant across both sets.
- Rock (cyan) and disco (red) dominate the top-right quadrant in both sets.
### Interpretation
The scatter plots suggest that the Valid and Test Sets contain similar genre distributions but with notable differences in clustering. For example:
- **Test Set**: Classical (orange) and reggae (yellow) show stronger separation from other genres compared to the Valid Set, where they are more dispersed.
- **Valid Set**: Blues and jazz are tightly grouped, potentially indicating overlapping features in the training data.
- **Test Set**: The dominance of classical and reggae in the bottom-left and bottom-right quadrants, respectively, may reflect biases in the test data or model performance.
The visual trends imply that the model’s ability to distinguish genres varies by dataset, with some genres (e.g., hip-hop, jazz) being more separable than others (e.g., pop, country). This could inform adjustments to the model’s feature engineering or training process.