\n
## Diagram: System Architecture - Evaluation Loop
### Overview
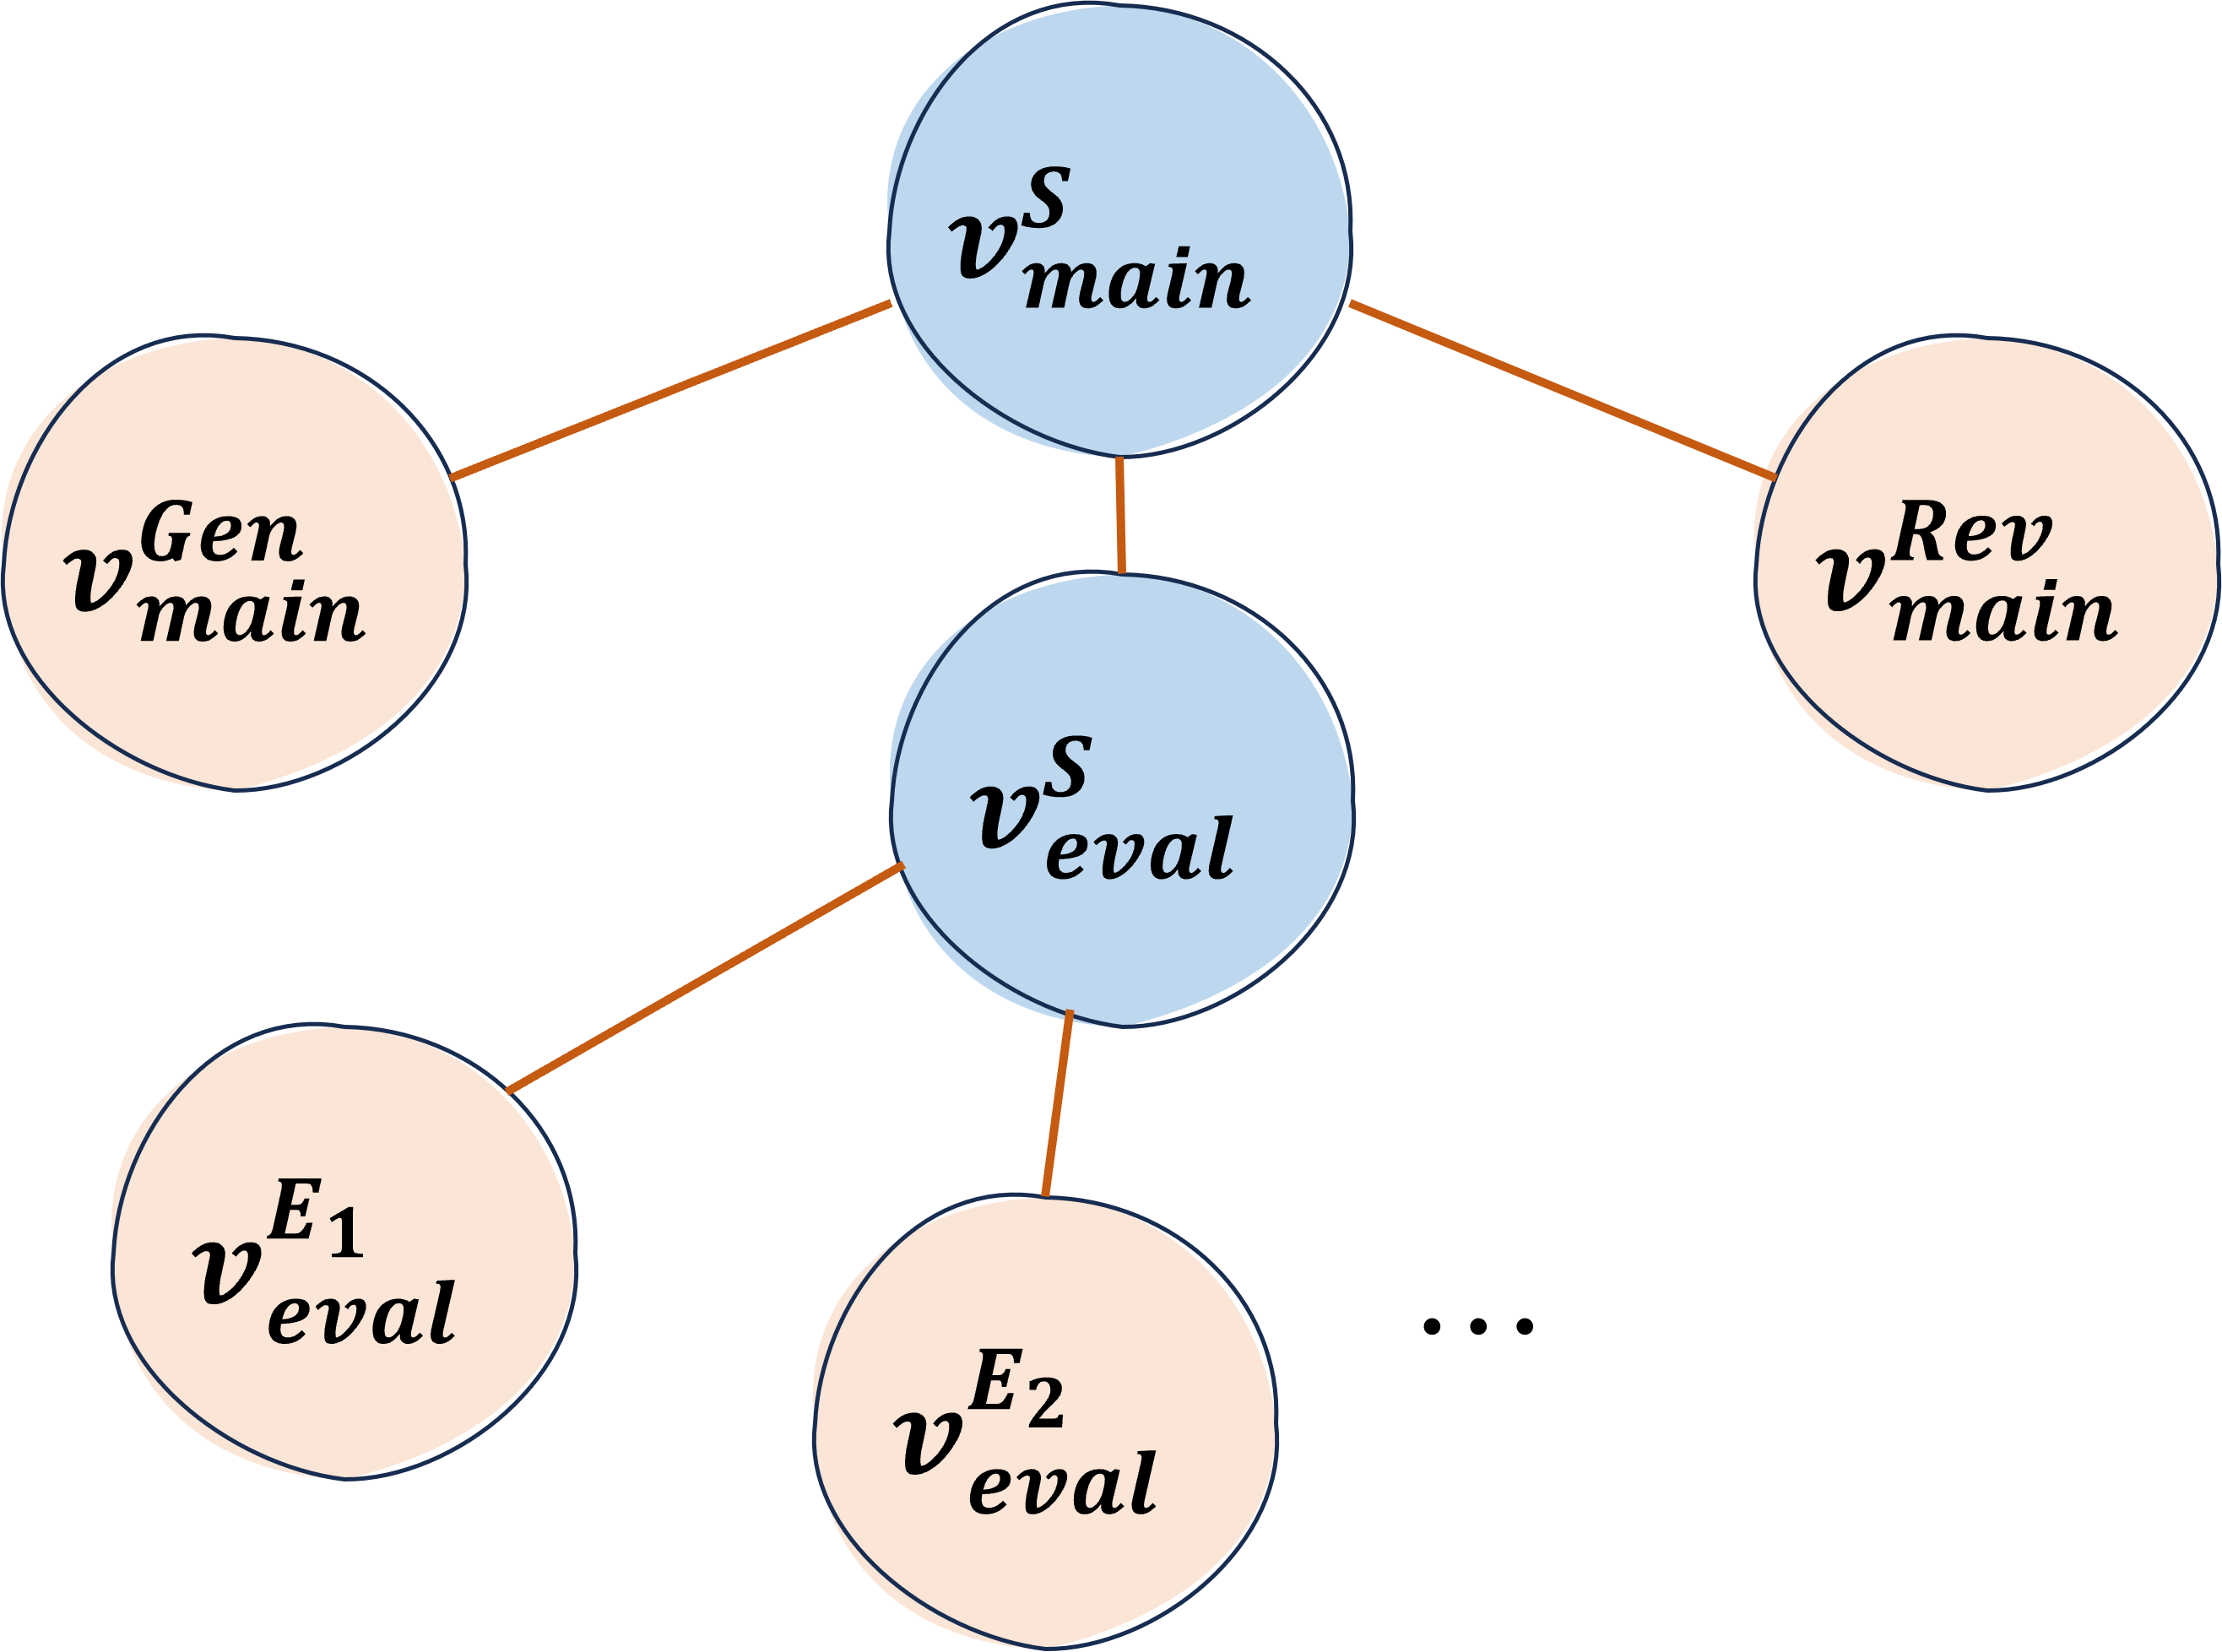
The image depicts a diagram illustrating a system architecture involving a generation, evaluation, and revision loop. It shows interconnected nodes representing different components of the system, with arrows indicating the flow of information or processes. The diagram appears to represent a cyclical process of generating content, evaluating it, and revising based on the evaluation.
### Components/Axes
The diagram consists of several nodes connected by directed edges (arrows). The nodes are labeled as follows:
* **ν<sup>Gen</sup><sub>main</sub>**: Located at the top-left.
* **ν<sup>S</sup><sub>main</sub>**: Located at the top-center.
* **ν<sup>Rev</sup><sub>main</sub>**: Located at the top-right.
* **ν<sup>S</sup><sub>eval</sub>**: Located in the center.
* **ν<sup>E<sub>1</sub></sup><sub>eval</sub>**: Located at the bottom-left.
* **ν<sup>E<sub>2</sub></sup><sub>eval</sub>**: Located at the bottom-center.
* **...**: Indicates that there are more evaluation nodes beyond ν<sup>E<sub>2</sub></sup><sub>eval</sub>.
The arrows represent the flow between these nodes.
### Detailed Analysis or Content Details
The diagram shows the following connections:
1. An arrow connects **ν<sup>Gen</sup><sub>main</sub>** to **ν<sup>S</sup><sub>eval</sub>**.
2. An arrow connects **ν<sup>S</sup><sub>main</sub>** to **ν<sup>S</sup><sub>eval</sub>**.
3. An arrow connects **ν<sup>Rev</sup><sub>main</sub>** to **ν<sup>S</sup><sub>eval</sub>**.
4. An arrow connects **ν<sup>S</sup><sub>eval</sub>** to **ν<sup>E<sub>1</sub></sup><sub>eval</sub>**.
5. An arrow connects **ν<sup>S</sup><sub>eval</sub>** to **ν<sup>E<sub>2</sub></sup><sub>eval</sub>**.
6. The "..." suggests that **ν<sup>S</sup><sub>eval</sub>** connects to further evaluation nodes (ν<sup>E<sub>n</sub></sup><sub>eval</sub>).
The superscript "S" likely denotes a "source" or "state", while "Gen" stands for "generation", "Rev" for "revision", and "Eval" for "evaluation". The subscript "main" likely indicates a primary or main component. The subscript "E<sub>1</sub>", "E<sub>2</sub>" likely indicates evaluation components.
### Key Observations
The diagram highlights a closed-loop system. The generation, main state, and revision components feed into the evaluation component, which in turn provides feedback (through the "..." notation) to potentially influence future generations or revisions. The central role of **ν<sup>S</sup><sub>eval</sub>** suggests it is a critical component in the system's operation.
### Interpretation
This diagram likely represents a system for iterative improvement, such as a machine learning model training loop or a content creation and refinement process.
* **ν<sup>Gen</sup><sub>main</sub>** could represent a generator network or a content creation module.
* **ν<sup>S</sup><sub>main</sub>** could represent the current state of the system.
* **ν<sup>Rev</sup><sub>main</sub>** could represent a revision or refinement module.
* **ν<sup>S</sup><sub>eval</sub>** could represent an evaluation module that assesses the quality or performance of the generated content or system state.
* **ν<sup>E<sub>1</sub></sup><sub>eval</sub>**, **ν<sup>E<sub>2</sub></sup><sub>eval</sub>**, etc., could represent individual evaluation metrics or evaluators.
The flow of information suggests that the system generates content, assesses its quality, revises it based on the evaluation, and repeats the process. The "..." notation indicates that the evaluation process can be scaled to include multiple evaluation metrics or evaluators. The diagram emphasizes the importance of continuous evaluation and refinement in achieving a desired outcome. The diagram does not provide any quantitative data, but rather a qualitative representation of the system's architecture and workflow.