## Diagram: Clinical Reasoning Process
### Overview
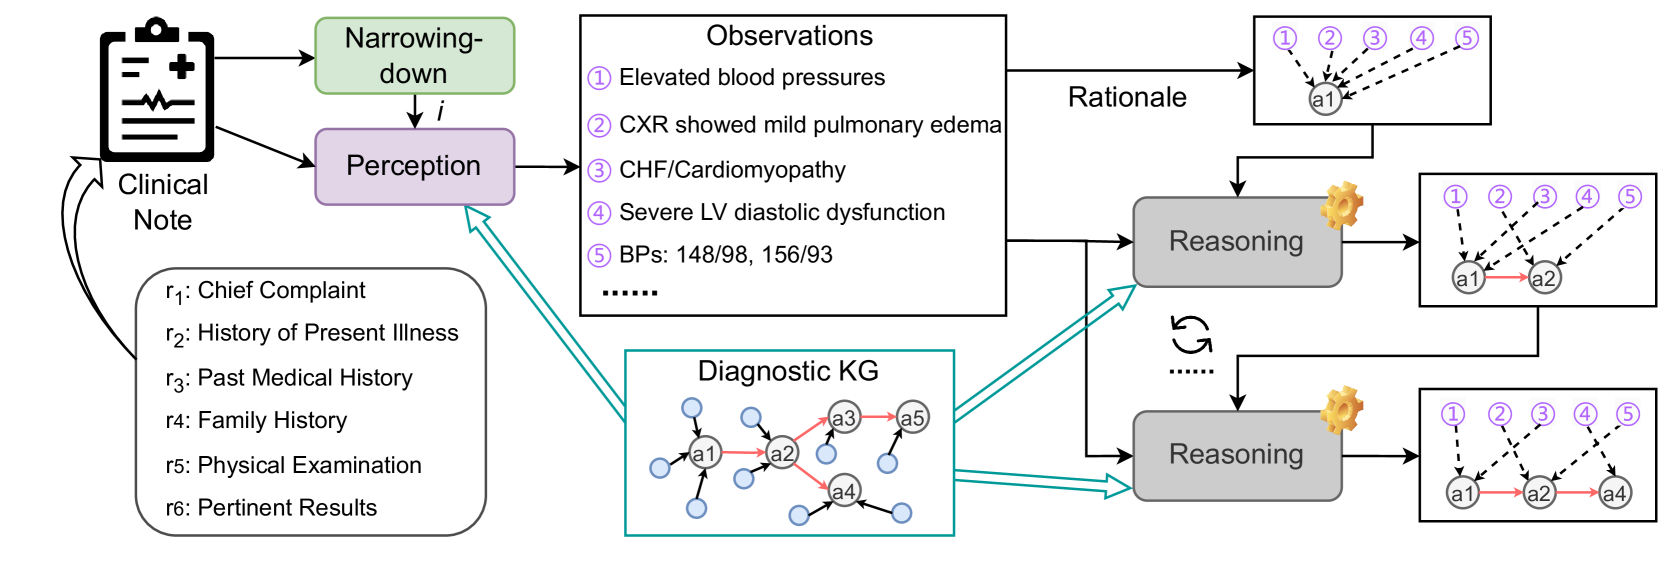
The image illustrates a clinical reasoning process, starting from a clinical note and progressing through perception, observations, diagnostic knowledge graph (KG), and reasoning steps to arrive at a rationale. The process involves iterative reasoning and feedback loops.
### Components/Axes
* **Clinical Note:** Represents the initial patient information, depicted as a clipboard icon.
* **Narrowing-down:** A green rectangular box indicating the process of filtering information.
* **Perception:** A purple rectangular box representing the interpretation of clinical data.
* **Observations:** A white rectangular box listing clinical findings.
* Numbered list of observations:
1. Elevated blood pressures
2. CXR showed mild pulmonary edema
3. CHF/Cardiomyopathy
4. Severe LV diastolic dysfunction
5. BPs: 148/98, 156/93
* **Diagnostic KG:** A blue rectangular box containing a knowledge graph with nodes labeled a1, a2, a3, a4, and a5. The nodes are interconnected with black and red arrows.
* **Reasoning:** Gray rectangular boxes representing reasoning steps, each associated with a gear icon.
* **Rationale:** White rectangular boxes showing the reasoning process. Each box contains nodes labeled 1 through 5, and nodes a1, a2, and a4.
* **Input Variables (r1-r6):**
* r1: Chief Complaint
* r2: History of Present Illness
* r3: Past Medical History
* r4: Family History
* r5: Physical Examination
* r6: Pertinent Results
### Detailed Analysis or Content Details
1. **Flow from Clinical Note:** The process begins with the "Clinical Note," which feeds into both "Narrowing-down" and "Perception."
2. **Narrowing-down to Perception:** "Narrowing-down" leads to "Perception" via an arrow labeled 'i'.
3. **Perception to Observations:** "Perception" leads to "Observations."
4. **Diagnostic KG Connection:** The "Diagnostic KG" provides input to "Perception" via a teal arrow.
5. **Observations to Reasoning:** "Observations" feed into the "Reasoning" blocks.
6. **Reasoning Iteration:** There is a feedback loop (represented by a curved arrow) between the two "Reasoning" blocks.
7. **Diagnostic KG to Reasoning:** The "Diagnostic KG" also feeds into the "Reasoning" blocks via teal arrows.
8. **Reasoning to Rationale:** Each "Reasoning" block leads to a "Rationale" block.
9. **Rationale Details:**
* The first "Rationale" box shows nodes 1-5 connected to node a1 with dashed lines.
* The second "Rationale" box shows nodes 1-5 connected to node a1 with dashed lines, and a red arrow from a1 to a2.
* The third "Rationale" box shows nodes 1-5 connected to node a1 with dashed lines, a red arrow from a1 to a2, and a red arrow from a2 to a4.
10. **Diagnostic KG Details:**
* Node a1 has connections to multiple unlabeled nodes.
* Node a2 is connected to a1 (red arrow), a3 (red arrow), and a4 (red arrow).
* Node a3 is connected to a2 (red arrow) and a5 (red arrow).
* Node a4 is connected to a2 (red arrow) and other unlabeled nodes.
* Node a5 is connected to a3 (red arrow).
### Key Observations
* The diagram illustrates an iterative process of clinical reasoning.
* The "Diagnostic KG" and "Observations" serve as key inputs for the "Reasoning" process.
* The feedback loop between the "Reasoning" blocks suggests an iterative refinement of the diagnosis.
### Interpretation
The diagram represents a model for clinical decision-making. It starts with initial clinical data, which is then filtered and interpreted. Observations are made based on this perception, and a diagnostic knowledge graph is consulted. Reasoning steps are performed, potentially iteratively, to arrive at a rationale or diagnosis. The feedback loop highlights the dynamic nature of clinical reasoning, where initial assessments can be revised based on new information or insights. The connections between the Diagnostic KG and the Reasoning blocks suggest that prior knowledge and established relationships between medical concepts play a crucial role in the diagnostic process.