\n
## Diagram: Clinical Note Reasoning Process
### Overview
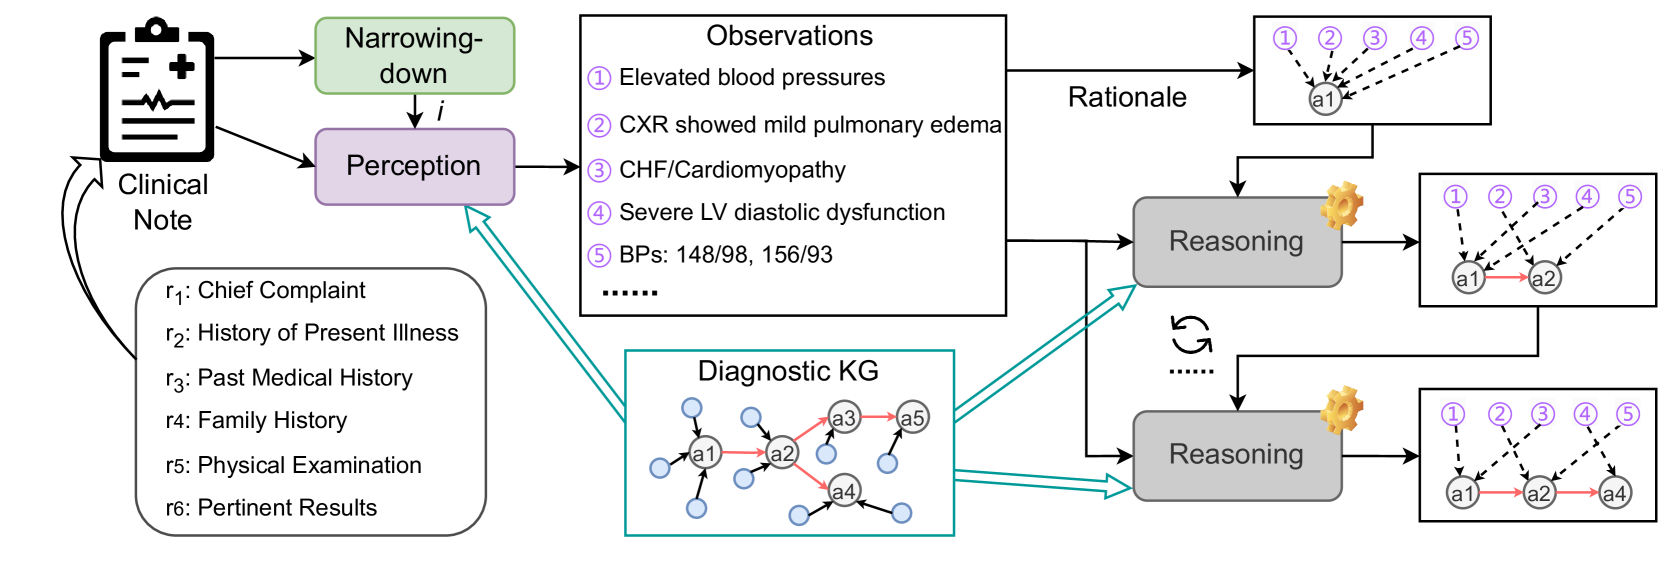
This diagram illustrates a process for reasoning from a clinical note to a diagnosis, utilizing observations and a diagnostic knowledge graph (KG). The process involves perception, narrowing down information, rationale generation, and iterative reasoning steps.
### Components/Axes
The diagram consists of the following components:
* **Clinical Note:** Represented by a document icon with plus and minus symbols, and a list of components:
* r₁: Chief Complaint
* r₂: History of Present Illness
* r₃: Past Medical History
* r₄: Family History
* r₅: Physical Examination
* r₆: Pertinent Results
* **Perception & Narrowing-down:** A process block connecting the Clinical Note to Observations.
* **Observations:** A numbered list of clinical findings:
* ① Elevated blood pressures
* ② CXR showed mild pulmonary edema
* ③ CHF/Cardiomyopathy
* ④ Severe LV diastolic dysfunction
* ⑤ BPs: 148/98, 156/93
* ...... (indicating more observations exist)
* **Rationale:** A block labeled "Rationale" connected to the Observations and the Reasoning blocks.
* **Reasoning:** Three stacked blocks labeled "Reasoning", connected by a looping arrow, indicating iterative processing.
* **Diagnostic KG:** A graph consisting of nodes labeled a1 through a5, connected by edges.
* **Connections:** Arrows indicating the flow of information between components. Dashed arrows connect Observations to Reasoning blocks.
### Detailed Analysis or Content Details
The diagram depicts a flow of information starting from a Clinical Note. The note is processed through "Perception" and "Narrowing-down" to generate "Observations". These observations (①-⑤) are then used to generate a "Rationale". The rationale, along with the observations, feeds into a "Reasoning" block. The reasoning process is iterative, as indicated by the looping arrow connecting the three Reasoning blocks. The Diagnostic KG appears to provide background knowledge used in the reasoning process.
Specifically:
* **Observation ⑤** provides specific blood pressure readings: 148/98 and 156/93.
* The Diagnostic KG contains 5 nodes: a1, a2, a3, a4, and a5.
* Each Reasoning block receives input from the Observations (①-⑤) and the Rationale.
* The output of each Reasoning block is fed back into the next iteration of the Reasoning process.
### Key Observations
* The process is iterative, suggesting that the reasoning process refines the diagnosis over multiple steps.
* The Diagnostic KG plays a central role in the reasoning process, providing contextual knowledge.
* The diagram does not specify the nature of the "Rationale" or the specific reasoning mechanisms employed.
* The "......" after Observation ⑤ indicates that the list of observations is not exhaustive.
### Interpretation
This diagram illustrates a simplified model of clinical reasoning. It suggests that a clinician begins with a comprehensive clinical note, extracts relevant observations, and then uses these observations, along with background knowledge (represented by the Diagnostic KG), to generate a rationale and arrive at a diagnosis. The iterative nature of the reasoning process highlights the importance of considering multiple factors and refining the diagnosis based on new information. The diagram emphasizes the transition from raw clinical data to a reasoned conclusion. The use of a knowledge graph suggests a move towards more structured and formalized approaches to clinical decision-making. The diagram is conceptual and does not provide details on the specific algorithms or methods used for perception, narrowing-down, rationale generation, or reasoning.