## Line Chart: Cosine Similarity vs. Layers
### Overview
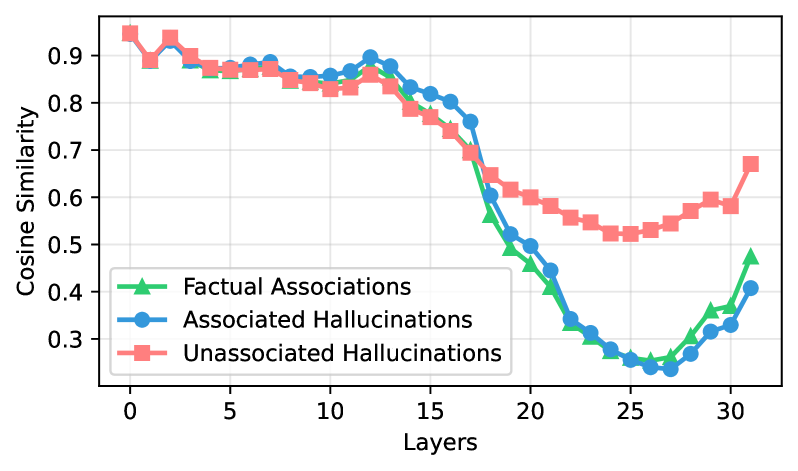
The image is a line chart comparing the cosine similarity across different layers for three categories: Factual Associations, Associated Hallucinations, and Unassociated Hallucinations. The x-axis represents the layers, and the y-axis represents the cosine similarity.
### Components/Axes
* **X-axis:** Layers, with markers at 0, 5, 10, 15, 20, 25, and 30.
* **Y-axis:** Cosine Similarity, with markers at 0.3, 0.4, 0.5, 0.6, 0.7, 0.8, and 0.9.
* **Legend:** Located in the bottom-left corner.
* Green line with triangle markers: Factual Associations
* Blue line with circle markers: Associated Hallucinations
* Red line with square markers: Unassociated Hallucinations
### Detailed Analysis
* **Factual Associations (Green):**
* Trend: Initially stable, then decreases sharply, reaches a minimum, and then increases.
* Values: Starts around 0.9, remains relatively constant until layer 12 (approx. 0.85), then decreases to approximately 0.27 at layer 27, and increases to approximately 0.47 at layer 31.
* **Associated Hallucinations (Blue):**
* Trend: Similar to Factual Associations, but the decrease is less sharp, and the recovery is also less pronounced.
* Values: Starts around 0.93, remains relatively constant until layer 12 (approx. 0.88), then decreases to approximately 0.24 at layer 27, and increases to approximately 0.41 at layer 31.
* **Unassociated Hallucinations (Red):**
* Trend: Initially stable, then decreases, plateaus, and finally increases slightly.
* Values: Starts around 0.94, remains relatively constant until layer 12 (approx. 0.84), then decreases to approximately 0.53 at layer 27, and increases to approximately 0.68 at layer 31.
### Key Observations
* All three categories show a decrease in cosine similarity between layers 12 and 27.
* Factual Associations and Associated Hallucinations have very similar trends and values.
* Unassociated Hallucinations maintain a higher cosine similarity compared to the other two categories after layer 18.
* The cosine similarity for Factual Associations and Associated Hallucinations recovers slightly after layer 27, while Unassociated Hallucinations show a plateau.
### Interpretation
The chart suggests that as the layers increase, the cosine similarity between the representations of factual associations, associated hallucinations, and unassociated hallucinations initially remains stable, then decreases significantly. This decrease indicates that the representations become less similar as the layers progress. The recovery in cosine similarity for Factual Associations and Associated Hallucinations after layer 27 might indicate a convergence or re-alignment of representations in the later layers. The higher cosine similarity for Unassociated Hallucinations after layer 18 suggests that these representations remain more consistent or stable compared to the other two categories. The data could indicate how different types of information are processed and transformed within the layers of a neural network.