## Bar Chart: Recompute Cost vs. Window Size
### Overview
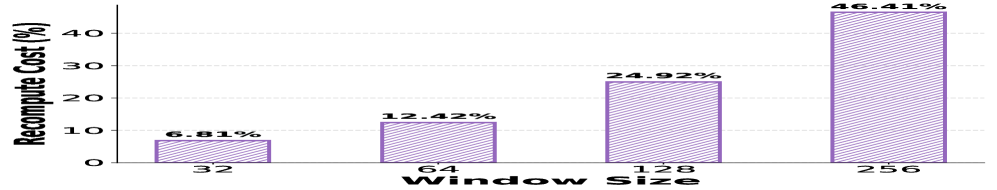
The image is a bar chart displaying the relationship between "Window Size" and "Recompute Cost (%)". The chart demonstrates a clear, positive correlation: as the window size increases, the percentage of recompute cost increases significantly.
### Components/Axes
* **Y-Axis:** Labeled "Recompute Cost (%)". The axis is marked with horizontal dashed grid lines at intervals of 10, ranging from 0 to 40.
* **X-Axis:** Labeled "Window Size". The axis contains four discrete categories: 32, 64, 128, and 256.
* **Data Series:** Represented by four vertical bars, all colored light purple with diagonal hatching.
* **Data Labels:** Numerical percentages are positioned directly above each bar.
### Detailed Analysis
The chart displays a consistent upward trend. As the Window Size doubles, the Recompute Cost increases by a factor of approximately 1.8x to 2x.
**Data Points (from left to right):**
* **Window Size 32:** The bar height is approximately 6.81%.
* **Window Size 64:** The bar height is approximately 12.42%.
* **Window Size 128:** The bar height is approximately 24.92%.
* **Window Size 256:** The bar height is approximately 46.41%.
### Key Observations
* **Scaling Trend:** The growth in recompute cost is nearly proportional to the window size. Doubling the window size (e.g., 32 to 64, 64 to 128) results in a roughly doubling of the recompute cost.
* **Magnitude:** The jump from the smallest window size (32) to the largest (256) represents a nearly 7-fold increase in recompute cost (from ~6.8% to ~46.4%).
* **Consistency:** The visual spacing and the numerical values suggest a predictable, likely linear or near-linear computational complexity associated with the window size parameter.
### Interpretation
This data likely originates from a technical analysis of an algorithm—possibly related to machine learning (e.g., attention mechanisms in Transformers, sliding window processing, or signal processing buffers).
The "Recompute Cost" represents the computational overhead required to recalculate data rather than retrieving it from memory. The chart illustrates a classic "memory vs. compute" trade-off:
1. **Performance Penalty:** Larger window sizes provide more context or data coverage but impose a heavy computational tax.
2. **Optimization Implications:** If this chart represents a system constraint, it suggests that increasing the window size beyond 128 becomes increasingly expensive, with the cost approaching 50% of the total operation at a window size of 256. Engineers using this system would need to carefully balance the benefit of a larger window against the significant performance degradation shown here.