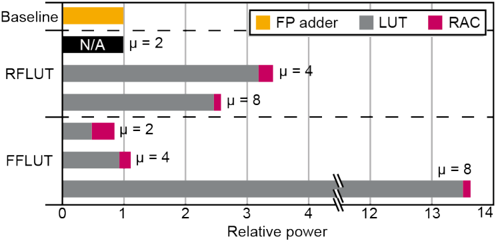
## Bar Chart: Relative Power Consumption by Method and Component
### Overview
The chart compares the relative power consumption of three computational methods (Baseline, RFLUT, FFLUT) across three components: FP adder (yellow), LUT (gray), and RAC (pink). Horizontal dashed lines at μ = 2, μ = 4, and μ = 8 serve as reference thresholds. The x-axis represents relative power (0–14), while the y-axis categorizes methods.
### Components/Axes
- **X-axis**: Relative power (0–14), linear scale.
- **Y-axis**: Methods (Baseline, RFLUT, FFLUT), ordered top to bottom.
- **Legend**:
- Yellow = FP adder
- Gray = LUT
- Pink = RAC
- **Dashed Lines**: μ = 2 (dash-dot), μ = 4 (dashed), μ = 8 (dash-dot).
### Detailed Analysis
1. **Baseline**:
- FP adder: ~1.0 (yellow bar).
- LUT: N/A (no bar).
- RAC: ~1.0 (pink bar).
2. **RFLUT**:
- FP adder: ~3.0 (yellow bar).
- LUT: ~8.0 (gray bar).
- RAC: ~4.0 (pink bar).
3. **FFLUT**:
- FP adder: ~4.0 (yellow bar).
- LUT: ~13.0 (gray bar).
- RAC: ~8.0 (pink bar).
### Key Observations
- **Baseline** has minimal power consumption across components but lacks LUT data.
- **RFLUT** shows moderate power usage, with LUT consuming the most (~8.0).
- **FFLUT** exhibits the highest power consumption, particularly in LUT (~13.0), surpassing all μ thresholds.
- Dashed lines at μ = 2, 4, and 8 suggest performance benchmarks; FFLUT exceeds all thresholds in LUT and RAC.
### Interpretation
The chart highlights trade-offs between computational methods and power efficiency. FFLUT’s significantly higher LUT power (~13.0) suggests it may prioritize performance over energy efficiency, while Baseline’s sparse data (missing LUT) implies incomplete optimization. The μ thresholds likely represent target power limits, with FFLUT exceeding all, indicating potential over-engineering or specialized use cases. The absence of LUT data for Baseline raises questions about its applicability in scenarios requiring LUT resources.