## Bar Chart: Relative Improvement over Gopher
### Overview
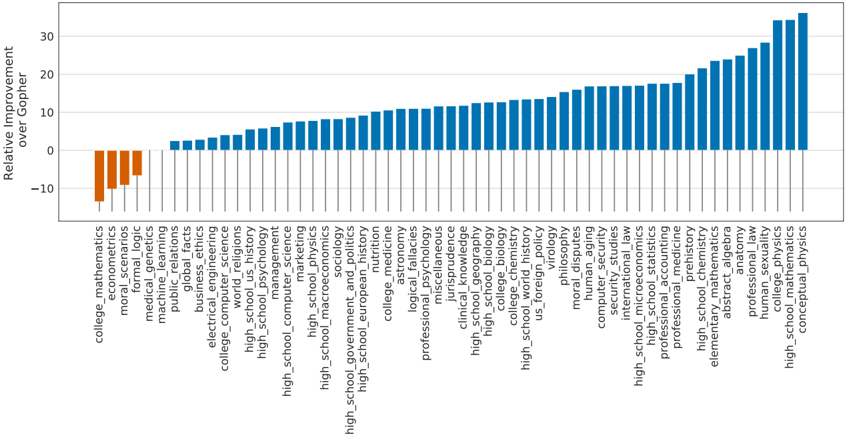
The image is a bar chart comparing the relative improvement of a system (unspecified) over a baseline system called "Gopher" across various subjects. The y-axis represents the relative improvement, while the x-axis lists the subjects. The bars are colored either blue (positive improvement) or orange (negative improvement).
### Components/Axes
* **Y-axis:** "Relative Improvement over Gopher". The scale ranges from -10 to 30, with tick marks at -10, 0, 10, 20, and 30.
* **X-axis:** Categorical axis listing various subjects. The labels are rotated vertically to fit.
* **Bar Colors:**
* Blue: Indicates a positive relative improvement over Gopher.
* Orange: Indicates a negative relative improvement over Gopher.
### Detailed Analysis
The chart displays the relative improvement over Gopher for a range of subjects. The subjects are listed along the x-axis, and the corresponding bar height indicates the magnitude of the improvement or decline.
Here's a breakdown of the data, starting from the left:
* **Negative Improvement (Orange Bars):**
* college_mathematics: Approximately -12
* econometrics: Approximately -9
* moral_scenarios: Approximately -8
* formal_logic: Approximately -6
* medical_genetics: Approximately -4
* **Positive Improvement (Blue Bars):**
* machine_learning: Approximately 2
* public_relations: Approximately 3
* global_facts: Approximately 3
* business_ethics: Approximately 3
* electrical_engineering: Approximately 4
* college_computer_science: Approximately 4
* world_religions: Approximately 5
* high_school_us_history: Approximately 6
* high_school_psychology: Approximately 6
* management: Approximately 6
* high_school_computer_science: Approximately 7
* marketing: Approximately 7
* high_school_physics: Approximately 8
* high_school_macroeconomics: Approximately 8
* sociology: Approximately 9
* high_school_government_and_politics: Approximately 9
* high_school_european_history: Approximately 9
* nutrition: Approximately 10
* college_medicine: Approximately 11
* astronomy: Approximately 11
* logical_fallacies: Approximately 12
* professional_psychology: Approximately 12
* miscellaneous: Approximately 13
* jurisprudence: Approximately 13
* clinical_knowledge: Approximately 14
* high_school_geography: Approximately 14
* high_school_biology: Approximately 15
* college_biology: Approximately 15
* college_chemistry: Approximately 16
* high_school_world_history: Approximately 16
* us_foreign_policy: Approximately 17
* virology: Approximately 17
* philosophy: Approximately 18
* moral_disputes: Approximately 18
* human_aging: Approximately 19
* computer_security: Approximately 19
* security_studies: Approximately 20
* international_law: Approximately 20
* high_school_microeconomics: Approximately 21
* high_school_statistics: Approximately 21
* professional_accounting: Approximately 22
* professional_medicine: Approximately 22
* prehistory: Approximately 23
* high_school_chemistry: Approximately 23
* elementary_mathematics: Approximately 24
* abstract_algebra: Approximately 24
* anatomy: Approximately 25
* professional_law: Approximately 26
* human_sexuality: Approximately 27
* college_physics: Approximately 28
* high_school_mathematics: Approximately 30
* conceptual_physics: Approximately 32
### Key Observations
* The majority of subjects show a positive relative improvement over Gopher.
* College mathematics shows the largest negative relative improvement.
* Conceptual physics shows the largest positive relative improvement.
* There is a wide range of performance across different subjects.
### Interpretation
The bar chart indicates that the system being evaluated generally outperforms the "Gopher" baseline across a variety of subjects. However, there are some subjects, particularly in college mathematics, where the system performs worse than Gopher. The substantial positive improvement in areas like conceptual physics and high school mathematics suggests that the system may be particularly well-suited for these domains. The data suggests that the system's strengths and weaknesses are subject-dependent, and further investigation may be warranted to understand the underlying reasons for these differences in performance.