## Scatter Plot: Trajectory Data
### Overview
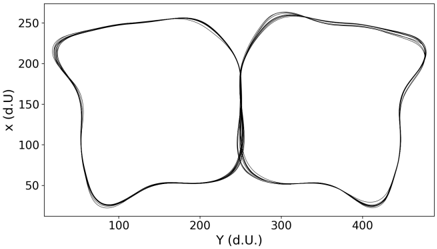
The image is a scatter plot displaying trajectory data. It shows the relationship between two variables, X and Y, both measured in arbitrary units (d.U.). Several overlapping trajectories are plotted, creating a visual representation of movement or change over time. The trajectories form a figure-eight-like pattern.
### Components/Axes
* **X-axis:** Labeled "Y (d.U.)", with a scale ranging from approximately 50 to 450 in increments of 100.
* **Y-axis:** Labeled "x (d.U)", with a scale ranging from 50 to 250 in increments of 50.
* **Data Series:** Multiple overlapping trajectories plotted in black.
### Detailed Analysis
The data series consist of several overlapping black lines, indicating multiple instances or repetitions of a similar trajectory. The trajectories trace a figure-eight-like pattern.
* **Left Loop:** The trajectories start from approximately (50, 50), rise to approximately (230, 50), move to approximately (230, 100), then move to approximately (70, 100), then move to approximately (70, 50), and finally return to approximately (50, 50).
* **Right Loop:** The trajectories start from approximately (250, 50), rise to approximately (430, 50), move to approximately (430, 100), then move to approximately (270, 100), then move to approximately (270, 50), and finally return to approximately (250, 50).
* **Intersection:** The trajectories intersect at approximately (200, 70) and (300, 70).
### Key Observations
* The trajectories are tightly clustered, suggesting a high degree of consistency in the underlying process.
* The figure-eight pattern indicates a cyclical or repetitive movement between two distinct regions.
* There is some variation in the trajectories, as indicated by the slight spread of the lines.
### Interpretation
The scatter plot visualizes the movement or change of an object or system in a two-dimensional space. The figure-eight pattern suggests a cyclical process with two distinct states or locations. The consistency of the trajectories implies a controlled or predictable system, while the slight variations indicate some degree of randomness or external influence. The data could represent various phenomena, such as the movement of a robot, the behavior of a biological system, or the fluctuations of a financial market.