## Line Graph: Cyclical Data Series Overlapping in Y-Axis Range
### Overview
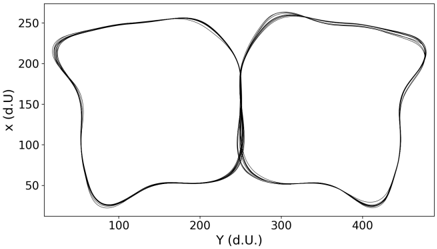
The image depicts a line graph with two overlapping closed-loop trajectories plotted against a Cartesian coordinate system. The graph shows cyclical patterns with distinct peaks and troughs, suggesting periodic or oscillatory behavior in the data. The loops intersect spatially but lack explicit numerical annotations or legends.
### Components/Axes
- **X-Axis (Horizontal)**: Labeled "Y (d.U.)" with a scale from 100 to 400 in increments of 100.
- **Y-Axis (Vertical)**: Labeled "x (d.U.)" with a scale from 50 to 250 in increments of 50.
- **Lines**: Two continuous black lines forming closed loops. No legend or color-coding is present to differentiate the lines.
- **Overlap Region**: The loops intersect between Y=200–300 (d.U.) and x=150–200 (d.U.).
### Detailed Analysis
1. **Left Loop**:
- Starts at approximately (Y=100, x=50).
- Peaks at (Y=200, x=250).
- Returns to the starting point, forming a counterclockwise loop.
- Exhibits a smooth, symmetrical arc with minimal deviation.
2. **Right Loop**:
- Begins at (Y=300, x=50).
- Peaks at (Y=400, x=250).
- Returns to the starting point, forming a clockwise loop.
- Mirrors the left loop’s shape but is offset along the Y-axis.
3. **Overlap**:
- Both loops intersect in the central region (Y=200–300, x=150–200).
- The overlapping area suggests a shared range of values where the two data series converge.
### Key Observations
- **Symmetry**: Both loops exhibit near-identical amplitude (x=50–250) but differ in Y-axis positioning.
- **Peak Alignment**: The maximum x-values (250) occur at Y=200 (left loop) and Y=400 (right loop), indicating a potential relationship between Y and x at critical points.
- **No Numerical Labels**: Data points lack explicit values, making precise quantification impossible.
- **Ambiguous Units**: "d.U." is undefined, limiting interpretation of scale.
### Interpretation
The graph likely represents two cyclical processes or variables with similar magnitudes but distinct Y-axis dependencies. The overlapping region implies a shared operational range where both processes interact or coexist. The absence of legends or numerical annotations prevents definitive conclusions about causality or correlation. The mirrored symmetry suggests a designed or natural balance between the two series, possibly indicating redundancy, competition, or complementary dynamics. Further context (e.g., data source, units) is required to validate hypotheses about the system’s behavior.