\n
## Line Charts: Response Length vs Step and Train Reward vs Step
### Overview
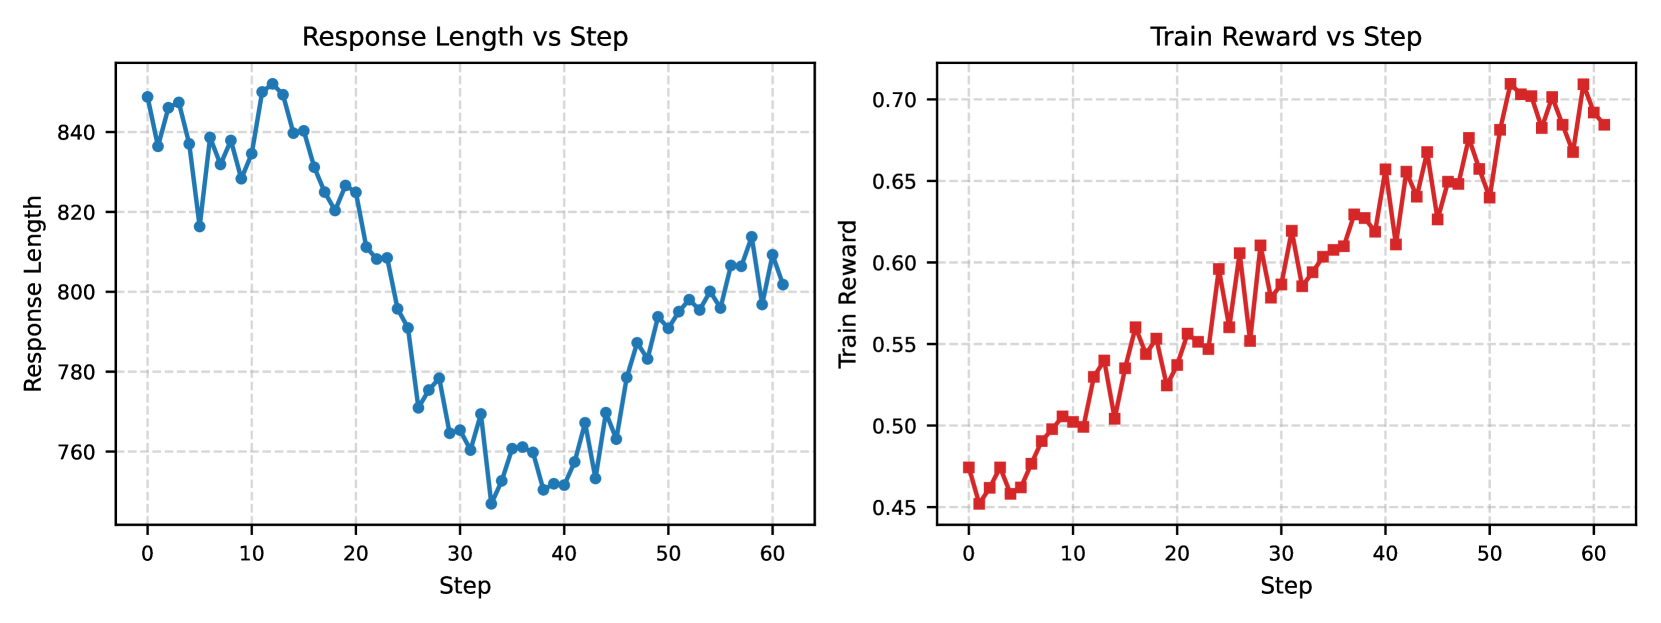
The image displays two side-by-line charts sharing a common x-axis ("Step") but measuring different metrics. The left chart tracks "Response Length" over 60 steps, while the right chart tracks "Train Reward" over the same 60 steps. Both charts use a grid background with dashed lines.
### Components/Axes
**Left Chart: "Response Length vs Step"**
* **Title:** "Response Length vs Step" (centered above the plot).
* **Y-axis Label:** "Response Length" (vertical text on the left).
* **Y-axis Scale:** Linear scale ranging from approximately 760 to 840, with major tick marks at 760, 780, 800, 820, and 840.
* **X-axis Label:** "Step" (centered below the plot).
* **X-axis Scale:** Linear scale from 0 to 60, with major tick marks at 0, 10, 20, 30, 40, 50, and 60.
* **Data Series:** A single blue line with circular markers at each data point.
* **Legend:** None present (single data series).
**Right Chart: "Train Reward vs Step"**
* **Title:** "Train Reward vs Step" (centered above the plot).
* **Y-axis Label:** "Train Reward" (vertical text on the left).
* **Y-axis Scale:** Linear scale ranging from approximately 0.45 to 0.70, with major tick marks at 0.45, 0.50, 0.55, 0.60, 0.65, and 0.70.
* **X-axis Label:** "Step" (centered below the plot).
* **X-axis Scale:** Linear scale from 0 to 60, with major tick marks at 0, 10, 20, 30, 40, 50, and 60.
* **Data Series:** A single red line with square markers at each data point.
* **Legend:** None present (single data series).
### Detailed Analysis
**Left Chart: Response Length Trend**
* **Trend Verification:** The blue line exhibits a distinct U-shaped or "dip and recover" trend. It starts high, descends to a minimum, and then ascends again.
* **Data Points (Approximate):**
* **Start (Step 0):** ~850
* **Initial High (Steps 0-15):** Fluctuates between ~820 and ~850.
* **Decline Phase (Steps 15-30):** A steep, consistent decline from ~825 to a minimum.
* **Minimum (Step ~30):** The lowest point is approximately 750.
* **Recovery Phase (Steps 30-60):** A steady, fluctuating increase from ~750 back to ~800.
* **End (Step 60):** ~800.
**Right Chart: Train Reward Trend**
* **Trend Verification:** The red line shows a clear, positive upward trend with moderate volatility. The overall direction is from bottom-left to top-right.
* **Data Points (Approximate):**
* **Start (Step 0):** ~0.47
* **Early Phase (Steps 0-20):** Gradual increase with fluctuations, reaching ~0.55.
* **Mid Phase (Steps 20-40):** Continued increase, crossing 0.60 around step 35.
* **Late Phase (Steps 40-60):** Stronger upward movement, with values consistently above 0.60.
* **Peak (Step ~55):** The highest point is approximately 0.71.
* **End (Step 60):** ~0.69.
### Key Observations
1. **Inverse Relationship at Mid-Training:** The most notable pattern is the inverse correlation around step 30. As "Response Length" hits its minimum (~750), "Train Reward" is in a period of steady increase (~0.58).
2. **Divergent Endpoints:** By step 60, "Response Length" (~800) has not returned to its initial high (~850), while "Train Reward" (~0.69) is significantly higher than its starting point (~0.47).
3. **Volatility:** Both metrics show step-to-step fluctuations, but the "Train Reward" chart appears to have slightly more pronounced short-term volatility relative to its scale.
4. **Synchronized Steps:** The x-axes are perfectly aligned, allowing for direct comparison of the two metrics at any given step.
### Interpretation
This pair of charts likely visualizes the training dynamics of a language model or similar AI system using a reinforcement learning or optimization technique where a "reward" signal is used.
* **Learning Progression:** The consistent rise in "Train Reward" indicates the model is successfully learning the task according to the defined reward function over the 60 steps.
* **Conciseness vs. Quality Trade-off:** The initial high response length followed by a sharp decrease suggests the model first produced verbose outputs. The training process then incentivized more concise responses (the dip). The subsequent partial recovery in length, coupled with ever-increasing reward, implies the model learned to balance conciseness with effectiveness—finding a length that maximizes reward, which is shorter than its initial guess but longer than its most concise phase.
* **Optimization Sweet Spot:** The minimum response length at step 30 does not correspond to the maximum reward. The highest rewards are achieved later, with moderately longer responses. This suggests the optimal policy for this task involves responses of a specific, intermediate length.
* **Training Stability:** The smooth, upward trend in reward, despite fluctuations, suggests stable training without catastrophic forgetting or divergence within this 60-step window.
**In summary, the data demonstrates a model undergoing optimization where it learns to modulate its output length as a key factor in maximizing a reward signal, ultimately converging on a policy that produces moderately concise, high-reward responses.**