## System Diagram: Neurosymbolic Inference
### Overview
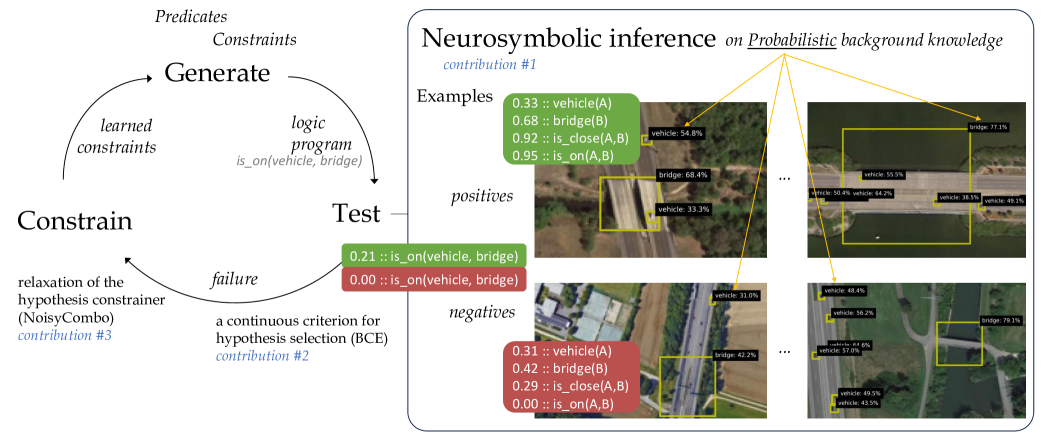
The image presents a system diagram illustrating a neurosymbolic inference process. It combines symbolic reasoning (logic programs, constraints) with neural network outputs (probabilities associated with object detection). The diagram shows a cyclical process of generating hypotheses, testing them against examples, and constraining the hypothesis space based on the results. The right side of the diagram shows examples of positive and negative cases with object detection probabilities.
### Components/Axes
* **Left Side (Process Flow)**:
* **Generate**: Top of the cycle, associated with "Predicates" and "Constraints". An arrow points from "Generate" to "Test".
* **Test**: Middle of the cycle. A "logic program is_on(vehicle, bridge)" is associated with this step.
* **Constrain**: Bottom of the cycle, associated with "relaxation of the hypothesis constrainer (NoisyCombo) contribution #3". An arrow points from "Constrain" to "Generate", completing the cycle.
* **Arrows**: Two curved arrows indicate the flow of information. One from "Generate" to "Test", and another from "Constrain" back to "Generate". A smaller arrow labeled "failure" points from "Test" to "Constrain".
* **Right Side (Examples)**:
* **Title**: "Neurosymbolic inference on Probabilistic background knowledge contribution #1"
* **Examples**: Section header.
* **Positives**: Labeled section containing examples where the "is_on(vehicle, bridge)" relationship is likely true.
* **Negatives**: Labeled section containing examples where the "is_on(vehicle, bridge)" relationship is likely false.
* **Images**: Several aerial images showing vehicles and bridges, with bounding boxes around detected objects.
* **Probabilities**: Probabilities associated with object detections and relationships, displayed next to the images.
### Detailed Analysis or Content Details
**Left Side (Process Flow)**:
* **Generate**: This step involves generating hypotheses based on predicates and constraints.
* **Test**: The generated hypotheses are tested using a logic program, specifically "is_on(vehicle, bridge)".
* **Constrain**: Based on the test results, the hypothesis space is constrained. This involves relaxation of the hypothesis constrainer using a method called "NoisyCombo" (contribution #3). A continuous criterion for hypothesis selection (BCE) is also mentioned (contribution #2).
* **Feedback Loop**: The process is cyclical, with the "Constrain" step feeding back into the "Generate" step, refining the hypotheses over time.
**Right Side (Examples)**:
* **Positive Examples**:
* The first positive example shows the following probabilities:
* 0.33 :: vehicle(A)
* 0.68 :: bridge(B)
* 0.92 :: is_close(A,B)
* 0.95 :: is_on(A,B)
* Image shows a bridge with vehicles on it. Bounding boxes are present around the vehicle and bridge.
* vehicle: 54.8%
* bridge: 68.4%
* vehicle: 33.3%
* The second positive example shows the following probabilities:
* Image shows a bridge with vehicles on it. Bounding boxes are present around the vehicles and bridge.
* bridge: 77.1%
* vehicle: 55.5%
* vehicle: 50.4%
* vehicle: 64.2%
* vehicle: 38.5%
* vehicle: 48.1%
* **Negative Examples**:
* The first negative example shows the following probabilities:
* 0.31 :: vehicle(A)
* 0.42 :: bridge(B)
* 0.29 :: is_close(A,B)
* 0.00 :: is_on(A,B)
* Image shows a bridge and a vehicle on a road next to the bridge. Bounding boxes are present around the vehicle and bridge.
* vehicle: 31.0%
* bridge: 42.2%
* The second negative example shows the following probabilities:
* Image shows a bridge and a vehicle on a road next to the bridge. Bounding boxes are present around the vehicles and bridge.
* vehicle: 48.4%
* vehicle: 56.2%
* vehicle: 44.6%
* vehicle: 57.0%
* bridge: 79.1%
* vehicle: 49.5%
* vehicle: 43.5%
* **Additional Notes**:
* The probabilities represent the confidence of the model in detecting the objects and their relationships.
* The positive examples have high probabilities for "is_on(A,B)", while the negative examples have low probabilities for "is_on(A,B)".
* The green boxes "0.21 :: is_on(vehicle, bridge)" and "0.00 :: is_on(vehicle, bridge)" are used to show the result of the test. Green indicates success, red indicates failure.
### Key Observations
* The diagram illustrates a neurosymbolic approach to reasoning about relationships between objects in images.
* The system uses a feedback loop to refine its hypotheses based on positive and negative examples.
* The probabilities associated with object detections play a crucial role in the inference process.
* The "is_on(vehicle, bridge)" relationship is used as a specific example to demonstrate the system's capabilities.
### Interpretation
The diagram demonstrates a system that combines neural networks and symbolic reasoning to infer relationships between objects in images. The cyclical process of generating, testing, and constraining hypotheses allows the system to learn and improve its accuracy over time. The use of probabilities from object detection provides a measure of confidence in the inferred relationships. The example of "is_on(vehicle, bridge)" shows how the system can be used to reason about spatial relationships between objects. The contributions #1, #2, and #3 likely refer to specific techniques or components used in the system, such as the neurosymbolic inference method, the hypothesis selection criterion, and the hypothesis constrainer.