## Chart: Correlation Function Plots for Different 'n' Values
### Overview
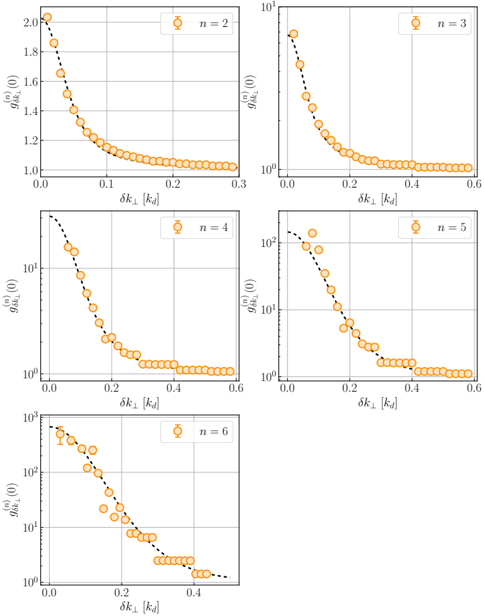
The image presents six individual plots, arranged in a 2x3 grid. Each plot displays a correlation function, g⁽ⁿ⁾(0), as a function of δk⊥/kᵈ. Each plot corresponds to a different value of 'n' (n=2, 3, 4, 5, 6), indicated at the top-right corner of each subplot. The plots appear to show a decay in the correlation function with increasing δk⊥/kᵈ. The y-axis is on a logarithmic scale for n=3, 4, 5, and 6.
### Components/Axes
* **x-axis label (all plots):** δk⊥ [kᵈ]
* **y-axis label (n=2):** g⁽²⁾(0)
* **y-axis label (n=3, 4, 5, 6):** g⁽ⁿ⁾(0) (logarithmic scale)
* **Title (each plot):** "n = [value]" where [value] is 2, 3, 4, 5, or 6.
* **Data Series:** A single series of orange data points with error bars in each plot.
* **Grid:** Each plot has a grid with lines at integer values on both axes.
### Detailed Analysis or Content Details
**Plot 1: n = 2**
* The data series shows a decreasing trend.
* At δk⊥/kᵈ ≈ 0.0, g⁽²⁾(0) ≈ 1.9.
* At δk⊥/kᵈ ≈ 0.1, g⁽²⁾(0) ≈ 1.4.
* At δk⊥/kᵈ ≈ 0.2, g⁽²⁾(0) ≈ 1.1.
* At δk⊥/kᵈ ≈ 0.3, g⁽²⁾(0) ≈ 1.0.
**Plot 2: n = 3**
* The data series shows a rapid initial decrease, followed by a slower decay.
* At δk⊥/kᵈ ≈ 0.0, g⁽³⁾(0) ≈ 10¹.
* At δk⊥/kᵈ ≈ 0.1, g⁽³⁾(0) ≈ 5.
* At δk⊥/kᵈ ≈ 0.2, g⁽³⁾(0) ≈ 2.
* At δk⊥/kᵈ ≈ 0.3, g⁽³⁾(0) ≈ 1.2.
* At δk⊥/kᵈ ≈ 0.4, g⁽³⁾(0) ≈ 0.8.
* At δk⊥/kᵈ ≈ 0.6, g⁽³⁾(0) ≈ 0.6.
**Plot 3: n = 4**
* Similar trend to n=3, with a rapid initial decrease.
* At δk⊥/kᵈ ≈ 0.0, g⁽⁴⁾(0) ≈ 10².
* At δk⊥/kᵈ ≈ 0.1, g⁽⁴⁾(0) ≈ 8.
* At δk⊥/kᵈ ≈ 0.2, g⁽⁴⁾(0) ≈ 3.
* At δk⊥/kᵈ ≈ 0.3, g⁽⁴⁾(0) ≈ 1.5.
* At δk⊥/kᵈ ≈ 0.4, g⁽⁴⁾(0) ≈ 0.9.
* At δk⊥/kᵈ ≈ 0.6, g⁽⁴⁾(0) ≈ 0.6.
**Plot 4: n = 5**
* Similar trend to n=4.
* At δk⊥/kᵈ ≈ 0.0, g⁽⁵⁾(0) ≈ 10².
* At δk⊥/kᵈ ≈ 0.1, g⁽⁵⁾(0) ≈ 7.
* At δk⊥/kᵈ ≈ 0.2, g⁽⁵⁾(0) ≈ 2.5.
* At δk⊥/kᵈ ≈ 0.3, g⁽⁵⁾(0) ≈ 1.2.
* At δk⊥/kᵈ ≈ 0.4, g⁽⁵⁾(0) ≈ 0.8.
* At δk⊥/kᵈ ≈ 0.6, g⁽⁵⁾(0) ≈ 0.6.
**Plot 5: n = 6**
* Similar trend to n=5.
* At δk⊥/kᵈ ≈ 0.0, g⁽⁶⁾(0) ≈ 10³.
* At δk⊥/kᵈ ≈ 0.1, g⁽⁶⁾(0) ≈ 10².
* At δk⊥/kᵈ ≈ 0.2, g⁽⁶⁾(0) ≈ 4.
* At δk⊥/kᵈ ≈ 0.3, g⁽⁶⁾(0) ≈ 1.8.
* At δk⊥/kᵈ ≈ 0.4, g⁽⁶⁾(0) ≈ 0.9.
### Key Observations
* The correlation function decreases as δk⊥/kᵈ increases for all values of 'n'.
* The initial rate of decay is faster for higher values of 'n'.
* The y-axis scale is logarithmic for n=3, 4, 5, and 6, indicating a wider range of correlation function values.
* The error bars are relatively small, suggesting good precision in the measurements.
### Interpretation
The plots demonstrate the decay of higher-order correlation functions with increasing wavevector difference (δk⊥). The parameter 'n' likely represents the order of the correlation function, and the plots show that higher-order correlations decay more rapidly. This suggests that the system becomes more disordered or uncorrelated as the wavevector difference increases, and this effect is more pronounced for higher-order correlations. The logarithmic scale used for n=3, 4, 5, and 6 indicates that these correlation functions span a much wider range of values than the second-order correlation function (n=2). The consistent decay pattern across different 'n' values suggests a fundamental property of the system being investigated. The data suggests a transition from correlated to uncorrelated behavior as δk⊥/kᵈ increases. The error bars indicate the uncertainty in the measurements, and their small size suggests a high degree of confidence in the observed trends.