## Line Charts: Average Attention Weight Comparison
### Overview
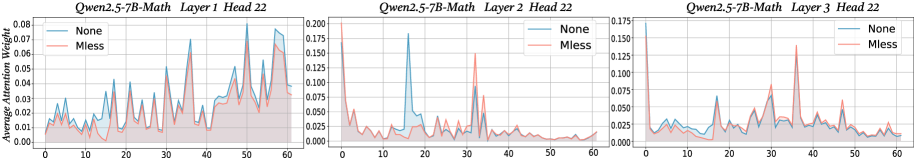
The image presents three line charts comparing the average attention weight of two models, "None" and "Mless," across different layers of a Qwen2.5-7B-Math model. Each chart represents a different layer (Layer 1, Layer 2, and Layer 3), while all charts represent the same head (Head 22). The x-axis represents an unspecified sequence or position, ranging from 0 to 60. The y-axis represents the average attention weight.
### Components/Axes
* **Titles:** Each chart has a title in the format "Qwen2.5-7B-Math Layer [Layer Number] Head 22".
* Chart 1: Qwen2.5-7B-Math Layer 1 Head 22
* Chart 2: Qwen2.5-7B-Math Layer 2 Head 22
* Chart 3: Qwen2.5-7B-Math Layer 3 Head 22
* **X-axis:** The x-axis is consistent across all three charts, ranging from 0 to 60 in increments of 10.
* **Y-axis:** The y-axis represents "Average Attention Weight." The scale varies between charts:
* Chart 1: 0.00 to 0.08 in increments of 0.01
* Chart 2: 0.000 to 0.200 in increments of 0.025
* Chart 3: 0.000 to 0.175 in increments of 0.025
* **Legend:** Located in the top-left corner of each chart.
* Blue line: "None"
* Red line: "Mless"
### Detailed Analysis
**Chart 1: Qwen2.5-7B-Math Layer 1 Head 22**
* **None (Blue):** The line fluctuates between approximately 0.01 and 0.04 for the first 40 units on the x-axis, with several peaks. It then increases, reaching a peak of approximately 0.075 around x=55.
* **Mless (Red):** The line generally follows the same pattern as the "None" line but with lower values. It fluctuates between approximately 0.005 and 0.025 for the first 40 units on the x-axis. It also increases after x=40, but remains below the "None" line.
**Chart 2: Qwen2.5-7B-Math Layer 2 Head 22**
* **None (Blue):** The line starts high, around 0.175 at x=0, then drops sharply to around 0.01 at x=5. It fluctuates between 0.01 and 0.05 until x=15, then spikes to 0.18 around x=17. After that, it remains relatively low, fluctuating between 0.01 and 0.05.
* **Mless (Red):** The line starts around 0.06 at x=0, then drops to around 0.01 at x=5. It fluctuates between 0.01 and 0.03 for the rest of the chart.
**Chart 3: Qwen2.5-7B-Math Layer 3 Head 22**
* **None (Blue):** The line starts around 0.175 at x=0, then drops sharply to around 0.01 at x=5. It fluctuates between 0.01 and 0.05 until x=15, then spikes to 0.18 around x=17. After that, it remains relatively low, fluctuating between 0.01 and 0.05.
* **Mless (Red):** The line starts around 0.06 at x=0, then drops to around 0.01 at x=5. It fluctuates between 0.01 and 0.03 for the rest of the chart.
### Key Observations
* In Layer 1, the "None" model generally has a higher average attention weight than the "Mless" model.
* In Layers 2 and 3, the "None" model shows a significant initial spike in attention weight, which is not present in the "Mless" model.
* The attention weights in Layers 2 and 3 are generally lower than in Layer 1, except for the initial spike in the "None" model.
### Interpretation
The charts compare the average attention weights of two model configurations ("None" and "Mless") across different layers of a Qwen2.5-7B-Math model. The differences in attention weights between the models and across layers suggest that the "Mless" configuration may have a different attention mechanism or a different distribution of attention across the input sequence compared to the "None" configuration. The initial spike in attention weight for the "None" model in Layers 2 and 3 could indicate a specific focus on the beginning of the input sequence in those layers. The data suggests that the "None" model has a higher average attention weight than the "Mless" model in Layer 1, while in Layers 2 and 3, the "None" model exhibits a significant initial spike in attention weight that is absent in the "Mless" model. This could indicate that the "None" model places more emphasis on the beginning of the input sequence in these layers.