## Chart: R1-Llama | MATH500 Accuracy vs. Ratio
### Overview
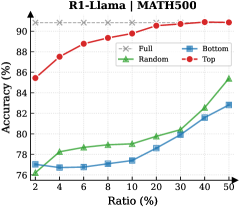
The image is a line chart comparing the accuracy of different data selection strategies (Full, Random, Bottom, Top) for the R1-Llama model on the MATH500 dataset, plotted against the data ratio used. The x-axis represents the ratio of data used (in percentage), and the y-axis represents the accuracy (in percentage).
### Components/Axes
* **Title:** R1-Llama | MATH500
* **X-axis:** Ratio (%) - with markers at 2, 4, 6, 8, 10, 20, 30, 40, 50
* **Y-axis:** Accuracy (%) - with markers at 76, 78, 80, 82, 84, 86, 88, 90
* **Legend:** Located at the top-right of the chart.
* Full (Gray dashed line with crosses)
* Random (Green line with triangles)
* Bottom (Blue line with squares)
* Top (Red line with circles)
### Detailed Analysis
* **Full (Gray dashed line with crosses):** This line represents the accuracy when using the full dataset. It starts at approximately 91.5% and remains relatively constant, with a slight increase to approximately 92.5%.
* Ratio 2%: ~91.5%
* Ratio 50%: ~92.5%
* **Random (Green line with triangles):** This line represents the accuracy when using a randomly selected subset of the data. It starts at approximately 76% and increases steadily with the ratio.
* Ratio 2%: ~76%
* Ratio 4%: ~78%
* Ratio 6%: ~78.7%
* Ratio 8%: ~79%
* Ratio 10%: ~79.5%
* Ratio 20%: ~80%
* Ratio 30%: ~81.5%
* Ratio 40%: ~82.5%
* Ratio 50%: ~85%
* **Bottom (Blue line with squares):** This line represents the accuracy when using the "bottom" subset of the data. It starts at approximately 77% and increases with the ratio, but not as steeply as the "Random" line.
* Ratio 2%: ~77%
* Ratio 4%: ~76.5%
* Ratio 6%: ~77%
* Ratio 8%: ~77%
* Ratio 10%: ~77.2%
* Ratio 20%: ~78.5%
* Ratio 30%: ~80%
* Ratio 40%: ~81.7%
* Ratio 50%: ~85%
* **Top (Red line with circles):** This line represents the accuracy when using the "top" subset of the data. It starts at approximately 85.5% and increases rapidly initially, then plateaus.
* Ratio 2%: ~85.5%
* Ratio 4%: ~87.7%
* Ratio 6%: ~88.8%
* Ratio 8%: ~89.2%
* Ratio 10%: ~89.7%
* Ratio 20%: ~90.5%
* Ratio 30%: ~91%
* Ratio 40%: ~91.2%
* Ratio 50%: ~91.5%
### Key Observations
* Using the full dataset ("Full") consistently yields the highest accuracy.
* Selecting the "top" subset of the data ("Top") performs significantly better than selecting a random subset ("Random") or the "bottom" subset ("Bottom"), especially at lower ratios.
* The "Random" and "Bottom" selection strategies show similar performance, with "Random" slightly outperforming "Bottom" at higher ratios.
* The accuracy of the "Top" selection strategy plateaus as the ratio increases, suggesting diminishing returns.
### Interpretation
The chart demonstrates the impact of data selection strategies on the accuracy of the R1-Llama model for the MATH500 dataset. The "Top" selection strategy appears to be the most effective way to improve accuracy when using a subset of the data. The "Full" dataset consistently provides the best performance, which is expected. The "Random" and "Bottom" selection strategies are less effective, indicating that the quality of the data used is more important than the quantity. The plateauing of the "Top" strategy suggests that there is a limit to how much accuracy can be gained by simply selecting the "top" data points. This information is valuable for optimizing the training process of the R1-Llama model and potentially other similar models.