## Heatmap: Test Accuracy Difference (BO - GCN) vs. Hyperparameters μ and λ
### Overview
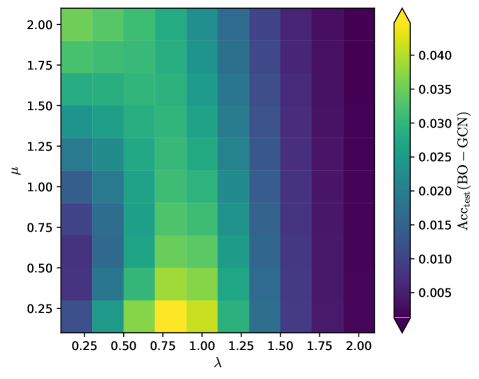
The image is a heatmap visualizing the difference in test accuracy between Bayesian Optimization (BO) and Graph Convolutional Networks (GCN) across varying hyperparameters μ (y-axis) and λ (x-axis). Colors range from purple (low values) to yellow (high values), with a colorbar indicating magnitude.
### Components/Axes
- **X-axis (λ)**: Labeled "λ", ranging from 0.25 to 2.00 in increments of 0.25.
- **Y-axis (μ)**: Labeled "μ", ranging from 0.25 to 2.00 in increments of 0.25.
- **Colorbar**: Vertical legend on the right, labeled "Acc_test(BO - GCN)", with values from 0.005 (purple) to 0.040 (yellow).
- **Grid**: White grid lines separate cells representing combinations of μ and λ.
### Detailed Analysis
- **Color Intensity**:
- **Brightest Yellow**: Located at λ=1.00, μ=0.25 (value ≈ 0.040).
- **Darkest Purple**: Located at λ=2.00, μ=2.00 (value ≈ 0.005).
- Intermediate values (green to blue) dominate the upper-right quadrant (high μ, high λ).
- **Trends**:
- Values decrease monotonically as λ increases for fixed μ.
- Values also decrease as μ increases for fixed λ, with steeper declines at higher μ.
- The highest values cluster in the lower-left quadrant (low λ, low μ).
### Key Observations
1. **Peak Performance**: The maximum test accuracy difference (BO - GCN) occurs at λ=1.00 and μ=0.25.
2. **Diminishing Returns**: Performance gains diminish sharply as λ exceeds 1.00 or μ exceeds 0.50.
3. **Parameter Sensitivity**: Lower μ values (≤0.50) are more impactful for maximizing BO's advantage over GCN.
### Interpretation
The heatmap demonstrates that Bayesian Optimization (BO) outperforms Graph Convolutional Networks (GCN) most significantly when λ is moderate (λ=1.00) and μ is low (μ=0.25). This suggests that BO's advantage is highly sensitive to hyperparameter tuning, with optimal performance achieved at specific parameter combinations. The rapid decline in performance differences for higher μ and λ implies that BO's benefits may be limited in scenarios requiring larger or more complex parameter spaces. The visualization underscores the importance of careful hyperparameter selection to leverage BO's strengths over GCN in this context.