## [Diagram]: Neuro-symbolic-probabilistic AI System Framework
### Overview
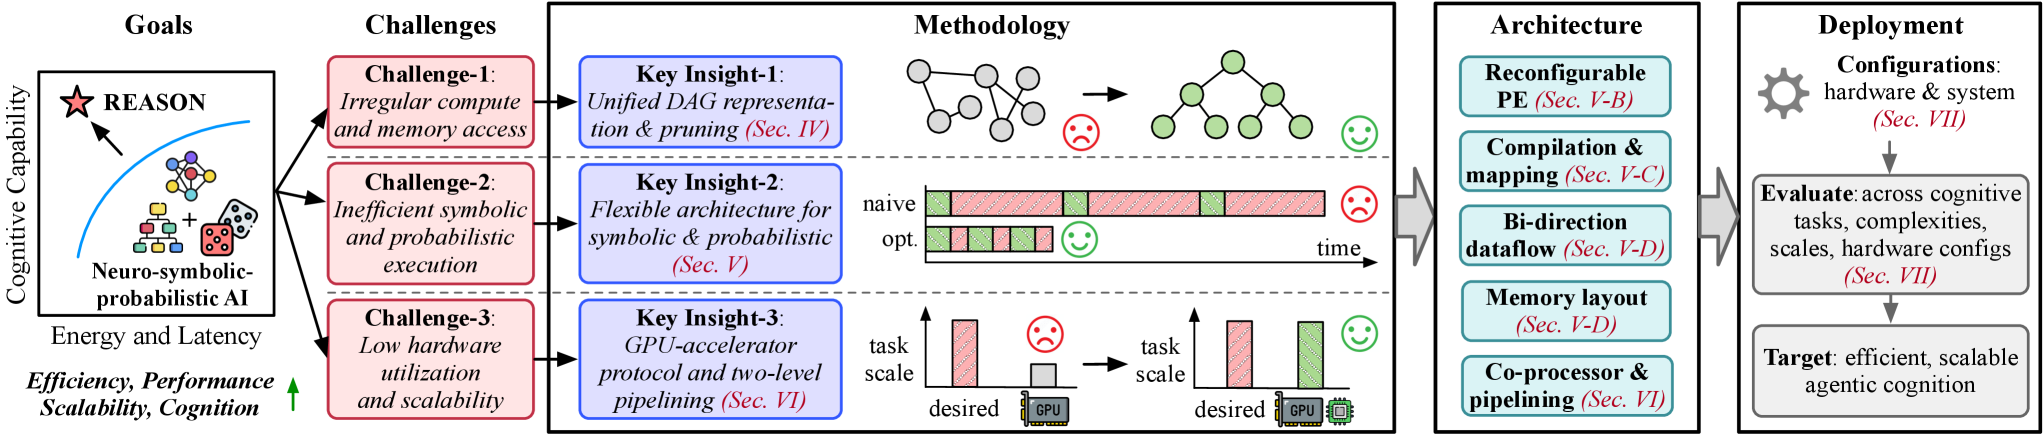
This image is a high-level system architecture diagram illustrating a research framework for "Neuro-symbolic-probabilistic AI." The diagram flows from left to right, mapping high-level goals to specific technical challenges, proposing methodological solutions, defining architectural components, and outlining deployment strategies. It serves as a roadmap for optimizing AI systems for efficiency, performance, and scalability.
### Components/Axes
The diagram is organized into five distinct vertical regions:
1. **Goals (Far Left):** A conceptual 2D plot.
* **Y-Axis:** "Cognitive Capability"
* **X-Axis:** "Energy and Latency"
* **Annotations:** A star labeled "REASON" sits at the top-left of the curve. Below the curve, a cluster of icons (a graph, a tree structure, and dice) is labeled "Neuro-symbolic-probabilistic AI."
* **Directional Indicator:** An upward-pointing arrow labeled "Efficiency, Performance, Scalability, Cognition."
2. **Challenges (Middle-Left):** Three red-bordered boxes stacked vertically.
* **Challenge-1:** "Irregular compute and memory access"
* **Challenge-2:** "Inefficient symbolic and probabilistic execution"
* **Challenge-3:** "Low hardware utilization and scalability"
3. **Methodology (Center):** Three blue-bordered boxes, each corresponding to a challenge row, containing text and visual representations.
* **Key Insight-1 (Sec. IV):** "Unified DAG representation & pruning"
* **Key Insight-2 (Sec. V):** "Flexible architecture for symbolic & probabilistic execution"
* **Key Insight-3 (Sec. VI):** "GPU-accelerator protocol and two-level pipelining"
4. **Architecture (Right-Middle):** A vertical stack of five light-blue boxes.
* "Reconfigurable PE (Sec. V-B)"
* "Compilation & mapping (Sec. V-C)"
* "Bi-direction dataflow (Sec. V-D)"
* "Memory layout (Sec. V-D)"
* "Co-processor & pipelining (Sec. VI)"
5. **Deployment (Far Right):** A vertical flow of two grey boxes.
* **Top Box:** "Configurations: hardware & system (Sec. VII)"
* **Middle Box:** "Evaluate: across cognitive tasks, complexities, scales, hardware configs (Sec. VII)"
* **Bottom Box:** "Target: efficient, scalable agentic cognition"
---
### Detailed Analysis
#### 1. Goals (Conceptual Chart)
* **Trend:** The curve represents the trade-off between energy/latency and cognitive capability. The upward arrow indicates that the desired trajectory for the proposed system is to increase cognitive capability while simultaneously improving efficiency and scalability.
#### 2. Methodology (Visual Explanations)
* **Row 1 (Insight-1):** Shows a transformation from a complex, unstructured graph to a simplified tree structure. A "sad face" icon appears before the transformation, and a "happy face" appears after, indicating the optimization of irregular compute.
* **Row 2 (Insight-2):** Compares "naive" execution (fragmented, sparse timeline) with "opt." (optimized) execution (dense, continuous timeline). The "happy face" indicates improved efficiency in symbolic/probabilistic execution.
* **Row 3 (Insight-3):** Compares "task scale" vs. "desired" output. The "sad face" shows a low-utilization state (small task bar on a large GPU), while the "happy face" shows high utilization (task bars filling the capacity).
#### 3. Architecture & Deployment
* The architecture section lists the specific technical modules required to implement the insights.
* The deployment section outlines the iterative process: configuring hardware, evaluating across various metrics, and aiming for the final goal of "agentic cognition."
---
### Key Observations
* **Problem-Solution Mapping:** The diagram is strictly structured as a 1:1 mapping. Each "Challenge" (Red) is directly addressed by a corresponding "Key Insight" (Blue).
* **Section References:** The inclusion of "(Sec. IV)", "(Sec. V)", etc., suggests this is a summary figure from a technical research paper, providing a navigational guide to the document's content.
* **Visual Sentiment:** The use of "sad face" (☹️) and "happy face" (🙂) icons provides an immediate visual summary of the impact of the proposed methodologies on system performance.
---
### Interpretation
This diagram demonstrates a **co-design approach** to AI hardware and software. It argues that current AI systems (likely standard neural networks) are insufficient for "agentic cognition" because they struggle with irregular data structures (DAGs) and symbolic logic, leading to inefficient hardware utilization.
The proposed solution is not just a software update, but a holistic architectural shift. By introducing "Unified DAG representation," "Flexible architecture," and "GPU-accelerator protocols," the authors aim to bridge the gap between high-level cognitive tasks and low-level hardware execution. The ultimate goal is to move beyond simple pattern matching toward a system capable of complex, scalable, and efficient reasoning (agentic cognition). The flow implies that without addressing these specific hardware-level bottlenecks, true agentic AI remains computationally prohibitive.