## Chart: CIFAR-100 Test Accuracy vs. d1
### Overview
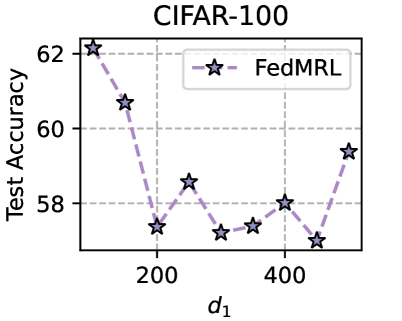
The image is a line chart displaying the test accuracy of the FedMRL model on the CIFAR-100 dataset as a function of the parameter d1. The chart shows how the test accuracy changes as d1 varies.
### Components/Axes
* **Title:** CIFAR-100
* **X-axis:**
* Label: d1
* Scale: 200, 400
* **Y-axis:**
* Label: Test Accuracy
* Scale: 58, 60, 62
* **Legend:** Located at the top-right of the chart.
* FedMRL (light purple dashed line with star markers)
### Detailed Analysis
* **FedMRL:** The light purple dashed line with star markers represents the test accuracy of the FedMRL model.
* At d1 = ~100, the test accuracy is approximately 62%.
* At d1 = ~150, the test accuracy is approximately 60.7%.
* At d1 = ~200, the test accuracy is approximately 57.4%.
* At d1 = ~275, the test accuracy is approximately 58.6%.
* At d1 = ~325, the test accuracy is approximately 57.2%.
* At d1 = ~375, the test accuracy is approximately 57.4%.
* At d1 = ~425, the test accuracy is approximately 58%.
* At d1 = ~475, the test accuracy is approximately 57%.
* At d1 = ~525, the test accuracy is approximately 59.4%.
### Key Observations
* The test accuracy initially decreases as d1 increases from ~100 to ~200.
* The test accuracy fluctuates between d1 = ~200 and d1 = ~500.
* The test accuracy increases again after d1 = ~500.
### Interpretation
The chart illustrates the relationship between the parameter d1 and the test accuracy of the FedMRL model on the CIFAR-100 dataset. The fluctuations in test accuracy suggest that the performance of the model is sensitive to the choice of d1. The initial decrease in accuracy might indicate that a small value of d1 is beneficial, but further increases lead to instability. The subsequent increase suggests that a larger value of d1 can improve performance again. Further investigation would be needed to determine the optimal value of d1 for this model and dataset.