\n
## Diagram: Watermark Strength & Translation System Flow
### Overview
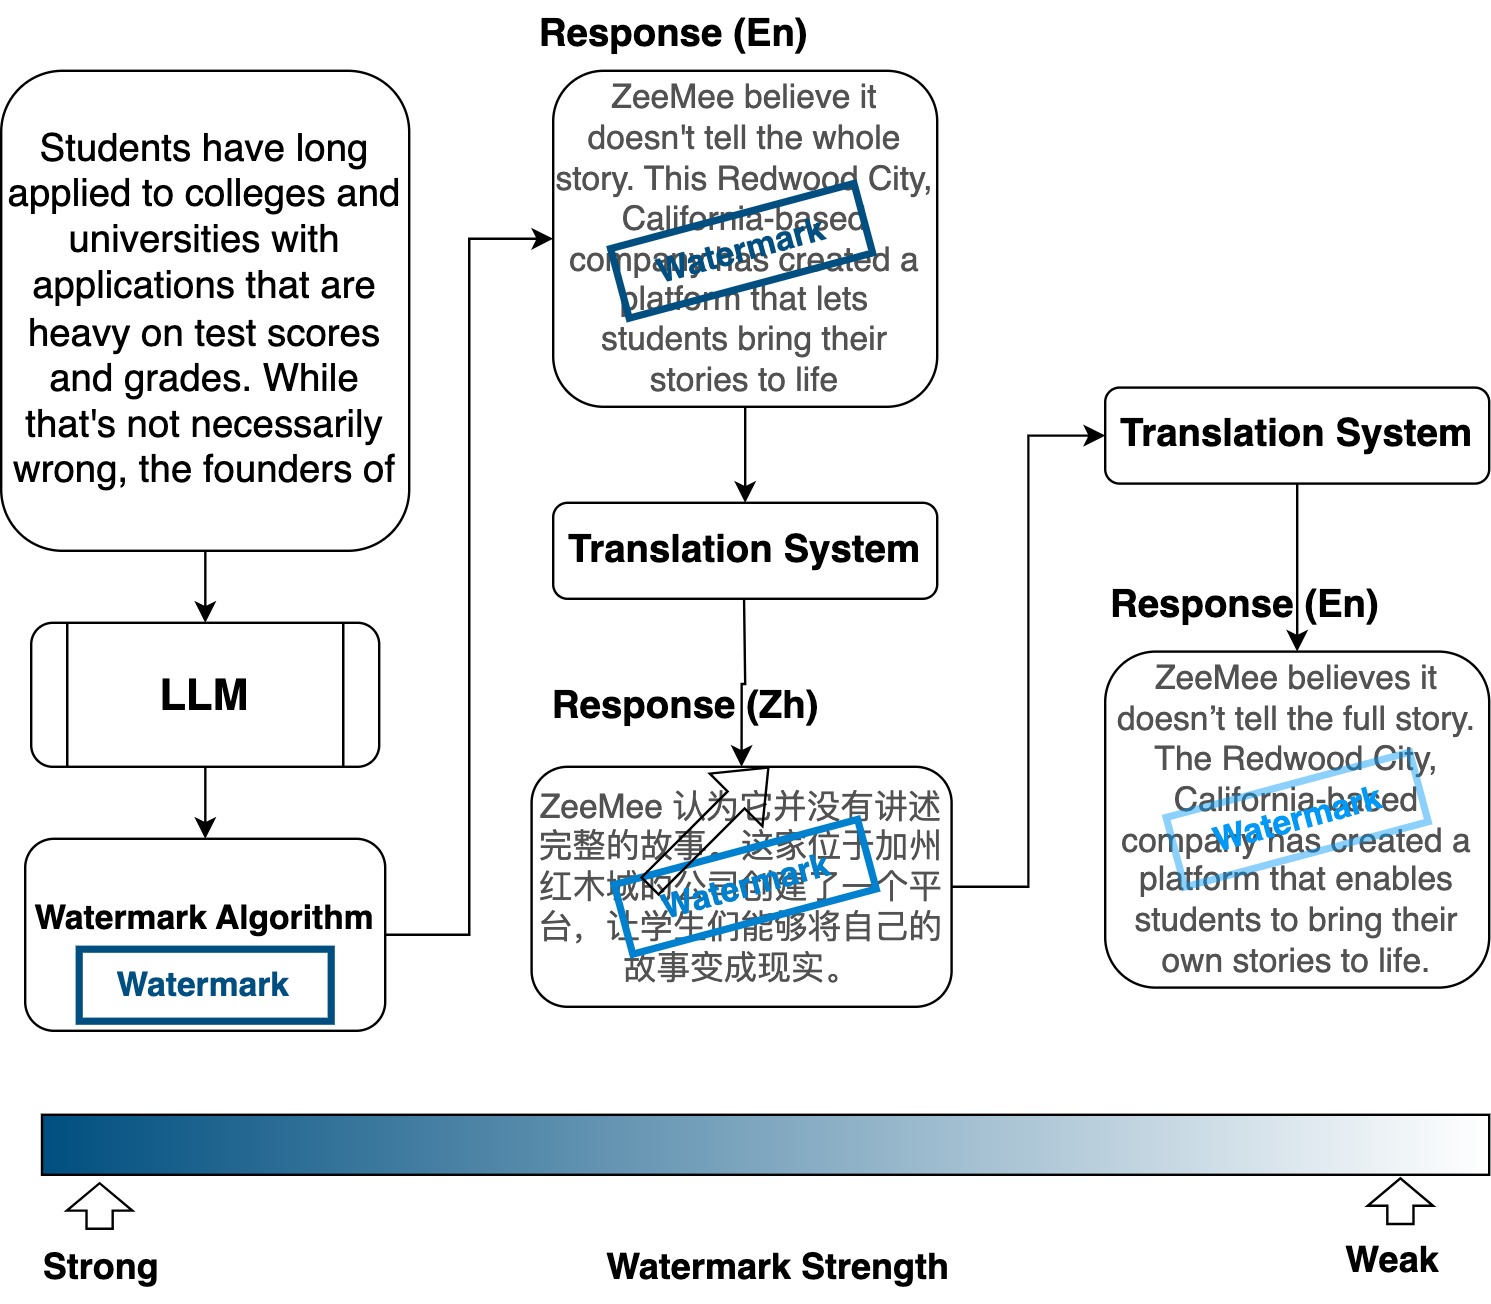
This diagram illustrates a system involving a Large Language Model (LLM), a Watermark Algorithm, a Translation System, and the resulting responses in both English (En) and Chinese (Zh). The diagram depicts the flow of text through these components and highlights the concept of "Watermark Strength," ranging from Strong to Weak.
### Components/Axes
* **Components:** LLM, Watermark Algorithm, Translation System, Response (En), Response (Zh).
* **Axis:** A horizontal axis labeled "Watermark Strength" with endpoints "Strong" and "Weak".
* **Arrows:** Arrows indicate the direction of information flow.
* **Text Blocks:** Several text blocks contain statements about college applications and the company ZeeMee.
### Detailed Analysis or Content Details
The diagram can be segmented into three main areas: Input Text, Processing Flow, and Output Responses.
**1. Input Text (Left Side):**
* A text block states: "Students have long applied to colleges and universities with applications that are heavy on test scores and grades. While that’s not necessarily wrong, the founders of…"
**2. Processing Flow (Center):**
* The input text flows into an "LLM" (Large Language Model) component.
* The output of the LLM flows into a "Watermark Algorithm" component, which then produces a "Watermark".
* The Watermark and the LLM output are fed into a "Translation System".
* The Translation System produces two responses: "Response (En)" and "Response (Zh)".
**3. Output Responses (Right Side):**
* **Response (En) - Top:** "ZeeMee believe it doesn’t tell the whole story. This Redwood City, California-based company created a platform that lets students bring their stories to life."
* **Response (En) - Bottom:** "ZeeMee believes it doesn’t tell the full story. The Redwood City, California-based company has created a platform that enables students to bring their own stories to life."
* **Response (Zh) - Center:** “ZeeMee 认为并没有讲述完整的故事情节。这家位于加利福尼亚的红木城公司创建了一个平台,让学生能够将自己的故事变成现实。”
* *English Translation:* "ZeeMee believes it doesn't tell the complete story. This Redwood City, California-based company has created a platform that allows students to bring their own stories to life."
**Watermark Strength:**
* The "Watermark" component is positioned above the "Watermark Strength" axis.
* The axis indicates that the watermark strength varies from "Strong" on the left to "Weak" on the right.
* The diagram implies that the strength of the watermark influences the output of the Translation System.
### Key Observations
* The diagram demonstrates a process where text is processed by an LLM, watermarked, translated, and then output in two languages.
* There are two versions of the English response, suggesting potential variations or refinements in the translation or post-processing.
* The "Watermark Strength" axis suggests that the presence and strength of a watermark can affect the output.
* The diagram does not provide specific numerical data or quantitative measurements.
### Interpretation
The diagram illustrates a system designed to detect or verify the origin of text generated by an LLM. The Watermark Algorithm likely embeds a subtle signal within the text that can be detected even after translation. The "Watermark Strength" axis suggests that the robustness of this signal can be adjusted. The two English responses may represent different levels of watermark strength or different processing steps.
The diagram highlights the challenges of maintaining provenance and authenticity in the age of LLMs, particularly when dealing with multilingual content. The system aims to address these challenges by embedding a detectable signal within the generated text. The diagram suggests that the system is designed to verify that the text originated from a specific source (ZeeMee, in this case) and has not been altered or misrepresented. The fact that the diagram includes both English and Chinese responses suggests that the watermark is designed to be resilient to translation.
The diagram is a conceptual illustration of a system and does not provide detailed technical specifications or performance metrics. It serves as a high-level overview of the key components and their interactions.