\n
## Charts: Sparsity vs. Explained Effect
### Overview
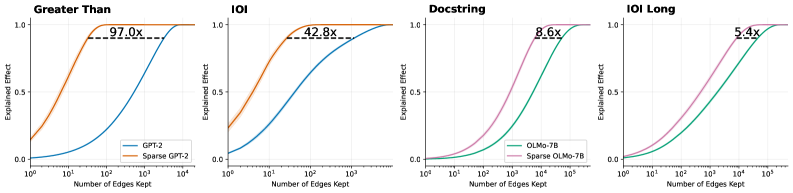
The image presents four charts comparing the "Explained Effect" of different models (GPT-2, OLMo-7B) and their sparse counterparts as a function of the "Number of Edges Kept". Each chart focuses on a different evaluation context: "Greater Than", "IOI", "Docstring", and "IOI Long". The charts visually demonstrate how much of the effect is explained as the number of edges retained in the model increases.
### Components/Axes
Each chart shares the following components:
* **X-axis:** "Number of Edges Kept" - Logarithmic scale from 10<sup>0</sup> to 10<sup>5</sup>.
* **Y-axis:** "Explained Effect" - Linear scale from 0.0 to 1.0.
* **Title:** Indicates the evaluation context ("Greater Than", "IOI", "Docstring", "IOI Long").
* **Legend:** Identifies the data series.
The four charts have the following specific data series:
1. **"Greater Than" Chart:**
* GPT-2 (Orange)
* Sparse GPT-2 (Blue)
2. **"IOI" Chart:**
* GPT-2 (Orange)
* Sparse GPT-2 (Blue)
3. **"Docstring" Chart:**
* OLMo-7B (Pink)
* Sparse OLMo-7B (Green)
4. **"IOI Long" Chart:**
* OLMo-7B (Pink)
* Sparse OLMo-7B (Green)
Each chart also includes a dashed horizontal line with a numerical value indicating the relative improvement of the sparse model over the dense model.
### Detailed Analysis
**1. "Greater Than" Chart:**
* **GPT-2 (Orange):** The line starts at approximately 0.05 at 10<sup>0</sup> edges and rapidly increases, reaching approximately 0.95 at 10<sup>3</sup> edges. It plateaus around 0.98 after 10<sup>3</sup> edges.
* **Sparse GPT-2 (Blue):** The line starts at approximately 0.05 at 10<sup>0</sup> edges and increases more slowly than GPT-2, reaching approximately 0.85 at 10<sup>3</sup> edges. It plateaus around 0.95 after 10<sup>3</sup> edges.
* **Improvement:** The dashed line indicates a 97.0x improvement.
**2. "IOI" Chart:**
* **GPT-2 (Orange):** The line starts at approximately 0.05 at 10<sup>0</sup> edges and rapidly increases, reaching approximately 0.95 at 10<sup>3</sup> edges. It plateaus around 0.99 after 10<sup>3</sup> edges.
* **Sparse GPT-2 (Blue):** The line starts at approximately 0.05 at 10<sup>0</sup> edges and increases more slowly than GPT-2, reaching approximately 0.80 at 10<sup>3</sup> edges. It plateaus around 0.95 after 10<sup>3</sup> edges.
* **Improvement:** The dashed line indicates a 42.8x improvement.
**3. "Docstring" Chart:**
* **OLMo-7B (Pink):** The line starts at approximately 0.1 at 10<sup>0</sup> edges and increases, reaching approximately 0.75 at 10<sup>3</sup> edges. It plateaus around 0.90 after 10<sup>3</sup> edges.
* **Sparse OLMo-7B (Green):** The line starts at approximately 0.1 at 10<sup>0</sup> edges and rapidly increases, reaching approximately 0.95 at 10<sup>3</sup> edges. It plateaus around 0.99 after 10<sup>3</sup> edges.
* **Improvement:** The dashed line indicates a 8.6x improvement.
**4. "IOI Long" Chart:**
* **OLMo-7B (Pink):** The line starts at approximately 0.1 at 10<sup>0</sup> edges and increases, reaching approximately 0.70 at 10<sup>3</sup> edges. It plateaus around 0.85 after 10<sup>3</sup> edges.
* **Sparse OLMo-7B (Green):** The line starts at approximately 0.1 at 10<sup>0</sup> edges and rapidly increases, reaching approximately 0.90 at 10<sup>3</sup> edges. It plateaus around 0.98 after 10<sup>3</sup> edges.
* **Improvement:** The dashed line indicates a 5.4x improvement.
### Key Observations
* In all four charts, the sparse models (Blue/Green) consistently show a slower initial increase in "Explained Effect" compared to their dense counterparts (Orange/Pink).
* However, the sparse models eventually reach comparable or even slightly higher levels of "Explained Effect" with fewer edges.
* The magnitude of improvement varies significantly across the evaluation contexts. "Greater Than" shows the largest improvement (97.0x), while "IOI Long" shows the smallest (5.4x).
* The "IOI" chart shows a very high explained effect for the dense GPT-2 model, reaching nearly 1.0 with a relatively small number of edges.
### Interpretation
These charts demonstrate the benefits of sparsity in large language models. While dense models initially achieve higher "Explained Effect" with a small number of edges, sparse models can achieve comparable or better performance with significantly fewer parameters (edges). This suggests that sparsity can be an effective technique for model compression and efficiency without sacrificing performance.
The varying degrees of improvement across different evaluation contexts suggest that the effectiveness of sparsity depends on the specific task or data distribution. The "Greater Than" context, for example, may be more amenable to sparsity than the "IOI Long" context.
The horizontal lines representing the improvement factor provide a quantitative measure of the benefits of sparsity. A higher improvement factor indicates a greater reduction in the number of parameters required to achieve a given level of performance. The fact that all improvement factors are greater than 1 indicates that sparsity is generally beneficial in these scenarios.
The charts highlight a trade-off between initial performance and long-term efficiency. Dense models may be faster to train and achieve higher initial performance, but sparse models offer the potential for significant long-term savings in terms of storage and computational cost.