## Bar Chart: Distribution of Single-Element Clusters
### Overview
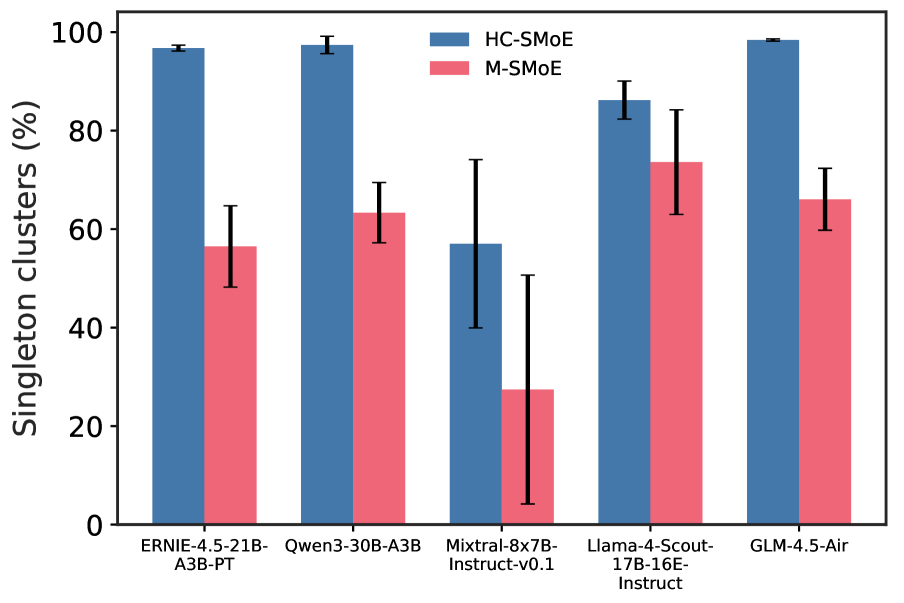
The bar chart compares the distribution of single-element clusters across five different models: ERNIE-4.5-21B-A3B-PT, Qwen3-30B-A3B, Mixtral-8x7B-Instruct-v0.1, Llama-4-Scout-17B-16E-Instruct, and GLM-4.5-Air. The y-axis represents the percentage of single-element clusters, while the x-axis lists the names of the models.
### Components/Axes
- **Y-axis**: Single-Element Clusters (%)
- **X-axis**: Model Names
- **Legend**:
- **HC-SMoE**: Blue bars
- **M-SMoE**: Red bars
- **Error Bars**: Indicate the standard deviation of the data points
### Detailed Analysis or ### Content Details
- **ERNIE-4.5-21B-A3B-PT**: The highest percentage of single-element clusters (95%) is represented by the HC-SMoE model, followed by M-SMoE (65%).
- **Qwen3-30B-A3B**: The HC-SMoE model has the highest percentage (98%), while M-SMoE has the lowest (60%).
- **Mixtral-8x7B-Instruct-v0.1**: The HC-SMoE model has the highest percentage (85%), and M-SMoE has the lowest (30%).
- **Llama-4-Scout-17B-16E-Instruct**: The HC-SMoE model has the highest percentage (90%), and M-SMoE has the lowest (70%).
- **GLM-4.5-Air**: The HC-SMoE model has the highest percentage (92%), and M-SMoE has the lowest (68%).
### Key Observations
- The HC-SMoE model consistently has the highest percentage of single-element clusters across all models.
- The M-SMoE model has the lowest percentage of single-element clusters across all models.
- There is a significant variation in the distribution of single-element clusters between the models.
### Interpretation
The data suggests that the HC-SMoE model has a higher tendency to generate single-element clusters compared to the M-SMoE model across all models. This could indicate that the HC-SMoE model is more likely to produce clusters with a single element, which might be a characteristic of its architecture or training data. The significant variation in the distribution of single-element clusters between the models could be due to differences in their architectures, training data, or other factors.