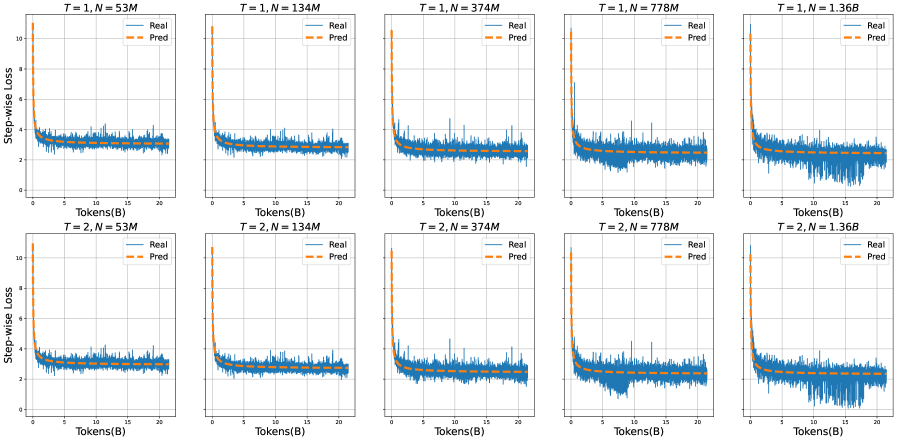
## Line Graphs: Step-wise Loss Comparison Across Model Sizes and Time Steps
### Overview
The image contains six line graphs arranged in a 2x5 grid, comparing real (blue) and predicted (orange) step-wise loss values across different model sizes (N) and time steps (T). Each graph tracks loss as tokens (B) increase, with axes labeled "Tokens(B)" (x-axis) and "Step-wise Loss" (y-axis, 0–10). Titles specify T (1 or 2) and N (53M, 134M, 374M, 778M, 1.36B).
### Components/Axes
- **X-axis**: "Tokens(B)" (0–20B), representing input data volume.
- **Y-axis**: "Step-wise Loss" (0–10), quantifying model performance degradation.
- **Legends**:
- Blue line: "Real" (actual loss values).
- Orange dashed line: "Pred" (predicted loss values).
- **Graph Titles**: Format "T = [1/2], N = [53M/134M/374M/778M/1.36B]".
### Detailed Analysis
1. **T = 1, N = 53M/134M/374M/778M/1.36B**:
- Both real and predicted loss curves decline sharply initially, then plateau.
- Predicted loss (orange) consistently stays slightly below real loss (blue), indicating underestimation.
- Larger N values (e.g., 1.36B) show smoother curves and faster stabilization (~2–3 loss by 20B tokens).
2. **T = 2, N = 53M/134M/374M/778M/1.36B**:
- Similar trends to T=1, but with increased volatility in real loss (blue) for smaller N (e.g., 53M).
- Predicted loss remains stable across all N, with minimal deviation from real loss in larger models (e.g., 1.36B).
### Key Observations
- **Model Size Impact**: Larger N (e.g., 1.36B) achieves lower, more stable loss faster than smaller N (e.g., 53M).
- **Prediction Accuracy**: Predicted loss closely mirrors real loss in larger models, suggesting reliable forecasting.
- **Time Step Effect**: T=2 graphs show slightly more fluctuation in real loss for smaller N, but no significant divergence from T=1 trends.
### Interpretation
The data demonstrates that increasing model size (N) improves loss reduction efficiency and prediction accuracy. Larger models stabilize faster and maintain lower loss, indicating better generalization. The predicted loss closely aligns with real loss in high-capacity models, validating the forecasting mechanism. The consistent plateau around 2–3 loss across all graphs suggests a performance ceiling beyond which additional tokens yield diminishing returns. This implies optimal token processing thresholds for different model scales.