## Heatmap: Fixed Recurrence Seed 2
### Overview
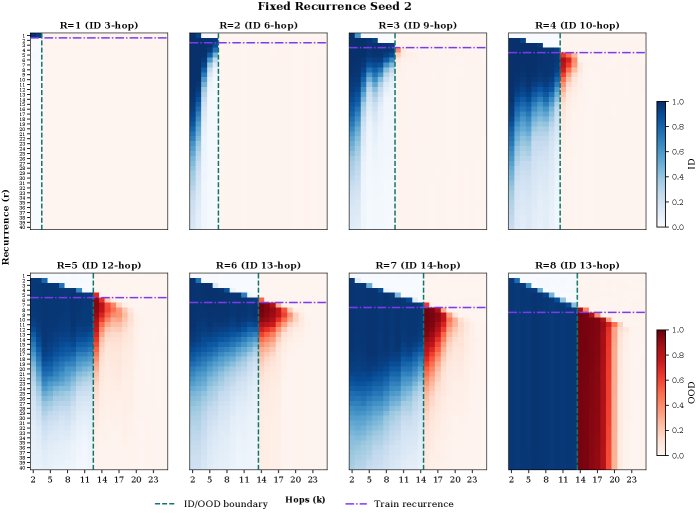
The image is a composite heatmap consisting of 8 panels arranged in two rows (4 panels per row). Each panel represents a different recurrence value (R=1 to R=8) and corresponding ID hop counts (3-hop to 13-hop). The heatmap visualizes the relationship between recurrence (r), hops (k), and out-of-distribution (OOD) performance, with color intensity indicating OOD values (0.0 to 1.0).
### Components/Axes
- **X-axis (Hops, k)**: Labeled "Hops (k)" with values ranging from 2 to 23.
- **Y-axis (Recurrence, r)**: Labeled "Recurrence (r)" with values ranging from 1 to 40.
- **Legend**:
- **Blue**: ID/OOD boundary (dashed vertical line).
- **Purple**: Train recurrence (dashed horizontal line).
- **Color bar**: OOD values from 0.0 (blue) to 1.0 (red).
- **Panel Titles**: Each panel is labeled with "R=X (ID Y-hop)", where X is the recurrence value and Y is the ID hop count (e.g., "R=1 (ID 3-hop)").
### Detailed Analysis
- **R=1 (ID 3-hop)**:
- A small blue block (OOD ≈ 0.0) at the top-left corner (r=1, k=2).
- Most of the panel is white (OOD ≈ 0.0), indicating minimal OOD values.
- **R=2 (ID 6-hop)**:
- A vertical gradient from blue (left) to white (right), with OOD values increasing slightly.
- The ID/OOD boundary (dashed line) separates the low-OOD region (left) from the higher-OOD region (right).
- **R=3 (ID 9-hop)**:
- A larger red region (OOD ≈ 0.8–1.0) appears in the top-right corner (r=1–5, k=14–23).
- The ID/OOD boundary is less distinct, with OOD values spreading across the panel.
- **R=4 (ID 10-hop)**:
- A significant red block (OOD ≈ 0.8–1.0) dominates the top-right (r=1–5, k=14–23).
- The train recurrence line (purple) intersects the red region, suggesting a threshold for OOD performance.
- **R=5 (ID 12-hop)**:
- A large red region (OOD ≈ 0.6–1.0) spans the top-right (r=1–10, k=14–23).
- The ID/OOD boundary is less visible, with OOD values dominating the panel.
- **R=6 (ID 13-hop)**:
- A red region (OOD ≈ 0.6–1.0) appears in the top-right (r=1–10, k=14–23).
- The train recurrence line intersects the red region, indicating a critical threshold.
- **R=7 (ID 14-hop)**:
- A red region (OOD ≈ 0.6–1.0) spans the top-right (r=1–10, k=14–23).
- The ID/OOD boundary is barely visible, with OOD values dominating.
- **R=8 (ID 13-hop)**:
- A red region (OOD ≈ 0.6–1.0) spans the top-right (r=1–10, k=14–23).
- The train recurrence line intersects the red region, reinforcing the threshold effect.
### Key Observations
1. **OOD Increase with R and k**:
- Higher recurrence values (R) and hop counts (k) correlate with increased OOD values (red regions).
- For R ≥ 3, OOD values exceed 0.6 in most panels, indicating significant out-of-distribution performance.
2. **Boundary and Train Recurrence Lines**:
- The ID/OOD boundary (dashed vertical line) separates low-OOD (blue/white) and high-OOD (red) regions.
- The train recurrence line (purple) intersects red regions in higher R panels, suggesting a critical threshold for OOD performance.
3. **Panel-Specific Trends**:
- R=1 (ID 3-hop) shows minimal OOD, while R=8 (ID 13-hop) exhibits the highest OOD values.
- The ID/OOD boundary becomes less distinct as R increases, indicating reduced model robustness.
### Interpretation
The heatmap demonstrates that **increased recurrence (R) and hop count (k) degrade the model's ability to distinguish in-distribution (ID) from out-of-distribution (OOD) data**. The ID/OOD boundary and train recurrence line act as thresholds, with higher R values crossing these thresholds and entering high-OOD regions. This suggests that deeper or more complex models (higher R) are more sensitive to OOD data, which could impact their reliability in real-world scenarios. The consistent red regions in higher R panels highlight a critical trend: **model performance deteriorates as complexity increases**, emphasizing the need for robustness testing in model design.