## Line Chart: SER vs. Pilot Size
### Overview
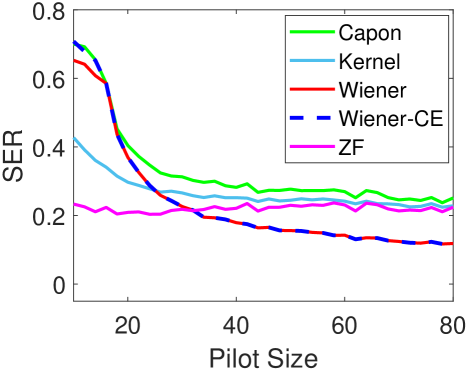
The image is a line chart comparing the Symbol Error Rate (SER) of five different signal processing algorithms (Capon, Kernel, Wiener, Wiener-CE, and ZF) as a function of Pilot Size. The chart shows how the SER changes as the Pilot Size increases from approximately 5 to 80.
### Components/Axes
* **X-axis:** Pilot Size, ranging from 0 to 80, with tick marks at intervals of 20.
* **Y-axis:** SER (Symbol Error Rate), ranging from 0 to 0.8, with tick marks at intervals of 0.2.
* **Legend:** Located in the top-right corner, identifying each algorithm by color:
* Green: Capon
* Light Blue: Kernel
* Red: Wiener
* Dashed Dark Blue: Wiener-CE
* Magenta: ZF
### Detailed Analysis
* **Capon (Green):** The SER starts at approximately 0.7 for a small pilot size, decreases sharply until a pilot size of around 20, and then gradually decreases to approximately 0.3 for a pilot size of 80.
* **Kernel (Light Blue):** The SER starts at approximately 0.4 for a small pilot size, decreases sharply until a pilot size of around 20, and then gradually decreases to approximately 0.25 for a pilot size of 80.
* **Wiener (Red):** The SER starts at approximately 0.65 for a small pilot size, decreases sharply until a pilot size of around 20, and then gradually decreases to approximately 0.12 for a pilot size of 80.
* **Wiener-CE (Dashed Dark Blue):** The SER starts at approximately 0.7 for a small pilot size, decreases sharply until a pilot size of around 20, and then gradually decreases to approximately 0.12 for a pilot size of 80. This line overlaps significantly with the Wiener line.
* **ZF (Magenta):** The SER remains relatively constant at approximately 0.2 between pilot sizes of 5 and 80.
### Key Observations
* All algorithms except ZF show a significant decrease in SER as the pilot size increases from 5 to 20.
* The Wiener and Wiener-CE algorithms have the lowest SER for larger pilot sizes (above 40).
* The ZF algorithm has the highest SER for larger pilot sizes (above 40).
* The SER of Capon and Kernel algorithms decreases more gradually than Wiener and Wiener-CE.
### Interpretation
The chart demonstrates the relationship between pilot size and symbol error rate for different signal processing algorithms. Increasing the pilot size generally improves the SER performance, especially for the Wiener and Wiener-CE algorithms. The ZF algorithm's performance is relatively unaffected by the pilot size, suggesting it may be less sensitive to pilot-based channel estimation. The Wiener and Wiener-CE algorithms appear to be the most effective in reducing the SER as the pilot size increases, indicating their suitability for scenarios where larger pilot sizes are feasible. The initial sharp decrease in SER for most algorithms suggests that even a moderate increase in pilot size can significantly improve performance.