# Technical Data Extraction: SER vs. Pilot Size Performance Chart
## 1. Image Classification and Overview
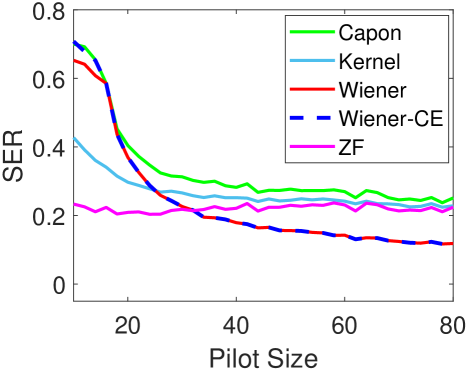
This image is a line graph depicting the relationship between **Pilot Size** (independent variable) and **SER** (Symbol Error Rate, dependent variable) for five different signal processing or estimation algorithms.
## 2. Component Isolation
### A. Header/Metadata
* **Language:** English.
* **Title:** None present within the image frame.
### B. Axis Configuration
* **Y-Axis (Vertical):**
* **Label:** `SER` (Symbol Error Rate).
* **Scale:** Linear, ranging from `0` to `0.8`.
* **Markers:** `0`, `0.2`, `0.4`, `0.6`, `0.8`.
* **X-Axis (Horizontal):**
* **Label:** `Pilot Size`.
* **Scale:** Linear, ranging from approximately `10` to `80`.
* **Markers:** `20`, `40`, `60`, `80`.
### C. Legend (Spatial Grounding: Top-Right Quadrant)
The legend is enclosed in a black bounding box.
* **Capon:** Solid Green line.
* **Kernel:** Solid Light Blue line.
* **Wiener:** Solid Red line.
* **Wiener-CE:** Dashed Dark Blue line (Note: This line overlaps the Wiener line almost perfectly).
* **ZF:** Solid Magenta line.
---
## 3. Trend Verification and Data Extraction
| Algorithm | Pilot Size 10 (Approx) | Pilot Size 20 (Approx) | Pilot Size 40 (Approx) | Pilot Size 80 (Approx) | Trend Description |
| :--- | :--- | :--- | :--- | :--- | :--- |
| **Capon** | 0.70 | 0.42 | 0.28 | 0.25 | Starts very high, drops sharply until size 25, then levels off. Highest error rate for sizes > 25. |
| **Kernel** | 0.42 | 0.30 | 0.25 | 0.23 | Moderate initial error, decreases steadily until size 30, then plateaus. |
| **Wiener** | 0.65 | 0.40 | 0.18 | 0.12 | Significant downward slope; achieves lowest SER as Pilot Size increases. |
| **Wiener-CE**| 0.70 | 0.40 | 0.18 | 0.12 | Virtually identical to Wiener; tracks closely as a single dashed line. |
| **ZF** | 0.23 | 0.23 | 0.22 | 0.22 | Relatively flat/invariant; unaffected by Pilot Size increase. |
---
## 4. Comparative Analysis and Summary
* **Best Performance (High Pilot Size):** The **Wiener** and **Wiener-CE** methods are the most efficient as Pilot Size increases, achieving the lowest SER (~0.12).
* **Best Performance (Low Pilot Size):** The **ZF** (Magenta) method is superior when the Pilot Size is very small (< 25), as it remains stable while others have high initial error rates.
* **Worst Performance:** The **Capon** (Green) method consistently results in the highest SER once the Pilot Size exceeds 25.
* **Convergence:** The Wiener and Wiener-CE lines track each other so closely that they appear as a single red-and-blue dashed line for the majority of the plot.