\n
## Chart: Performance Comparison of Optimization Methods
### Overview
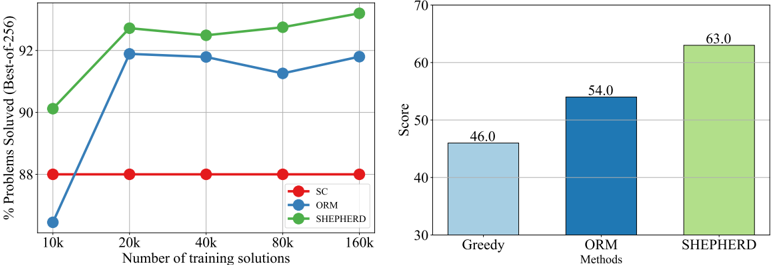
The image presents two charts comparing the performance of three optimization methods: SC (likely Stochastic Configuration), ORM (likely Optimization-based Refinement Method), and SHEPHERD. The left chart shows the percentage of problems solved (using a Best-of-256 metric) as a function of the number of training solutions, ranging from 10k to 160k. The right chart displays the overall score for each method.
### Components/Axes
**Left Chart:**
* **X-axis:** Number of training solutions (10k, 20k, 40k, 80k, 160k)
* **Y-axis:** % Problems Solved (Best-of-256), ranging from 0 to 70.
* **Legend:**
* SC (Red, diamond-shaped markers)
* ORM (Blue, circular markers)
* SHEPHERD (Green, triangle-shaped markers)
**Right Chart:**
* **X-axis:** Methods (Greedy, ORM, SHEPHERD)
* **Y-axis:** Score, ranging from 30 to 70.
### Detailed Analysis or Content Details
**Left Chart:**
* **SC (Red):** The line is relatively flat, hovering around 38% solved problems across all training solution counts. Approximately 38% ± 2%.
* **ORM (Blue):** The line shows a strong upward trend from 10k to 20k training solutions, increasing from approximately 0% to 65%. It then plateaus and slightly decreases to approximately 62% at 160k training solutions.
* 10k: ~0%
* 20k: ~65%
* 40k: ~64%
* 80k: ~61%
* 160k: ~62%
* **SHEPHERD (Green):** The line exhibits a consistent upward trend, starting at approximately 50% at 10k training solutions and reaching approximately 68% at 160k training solutions.
* 10k: ~50%
* 20k: ~65%
* 40k: ~66%
* 80k: ~65%
* 160k: ~68%
**Right Chart:**
* **Greedy:** Score of approximately 46.0.
* **ORM:** Score of approximately 54.0.
* **SHEPHERD:** Score of approximately 63.0.
### Key Observations
* SC consistently performs the worst, with a very low percentage of problems solved regardless of the number of training solutions.
* ORM shows significant improvement with increasing training solutions, but its performance plateaus after 20k solutions.
* SHEPHERD demonstrates a steady improvement in performance with more training solutions and achieves the highest overall score.
* The right chart confirms SHEPHERD's superior performance, with a significantly higher score than ORM and Greedy.
### Interpretation
The data suggests that SHEPHERD is the most effective optimization method among the three tested, particularly when a larger number of training solutions are available. ORM benefits from increased training data up to a point, after which its performance stabilizes. SC appears to be the least effective method, showing minimal improvement with more training data.
The consistent upward trend of SHEPHERD indicates that its performance continues to improve with more data, suggesting it can leverage larger datasets effectively. The plateauing of ORM suggests that it may reach a limit in its ability to refine solutions beyond a certain point. The consistently low performance of SC suggests it may be fundamentally limited in its ability to solve these types of problems.
The difference in scores on the right chart reinforces the findings from the left chart, highlighting SHEPHERD's overall superiority. The data implies that SHEPHERD is a robust and scalable optimization method, while ORM is effective up to a certain point, and SC is not a viable option for these problems.