TECHNICAL ASSET FINGERPRINT
f7ff611a363c2d83e513a0b9
Click to view fullscreen
Press ESC or click to close
FOUND IN PAPERS
EXPERT: healer-alpha-free VERSION 1
RUNTIME: free/openrouter/healer-alpha
INTEL_VERIFIED
## Bar Chart Series: Reflective Execution Performance Across Verification Types
### Overview
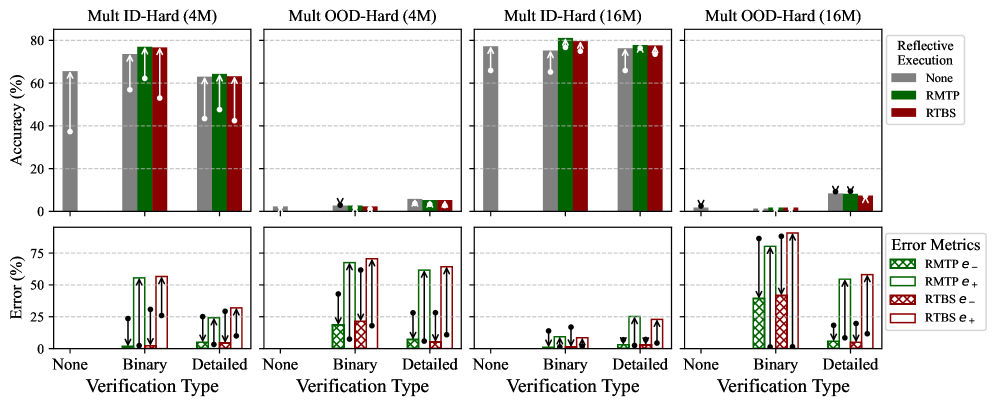
The image displays a 2x2 grid of bar charts comparing the performance of different "Reflective Execution" methods (None, RMTP, RTBS) across three "Verification Types" (None, Binary, Detailed). The top row measures Accuracy (%), and the bottom row measures Error (%). The charts are grouped by dataset difficulty and model size: "Mult ID-Hard" (In-Distribution) and "Mult OOD-Hard" (Out-Of-Distribution), each tested with 4M and 16M parameter models.
### Components/Axes
* **Main Title (Implicit):** Performance of Reflective Execution Methods.
* **Panel Subtitles (Top Row, Left to Right):**
1. `Mult ID-Hard (4M)`
2. `Mult OOD-Hard (4M)`
3. `Mult ID-Hard (16M)`
4. `Mult OOD-Hard (16M)`
* **Y-Axis (Top Row):** `Accuracy (%)`. Scale ranges from 0 to 80 with increments of 20.
* **Y-Axis (Bottom Row):** `Error (%)`. Scale ranges from 0 to 75 with increments of 25.
* **X-Axis (All Charts):** `Verification Type`. Categories are `None`, `Binary`, `Detailed`.
* **Legend 1 (Reflective Execution - Top Right of Top Row):**
* Gray Bar: `None`
* Green Bar: `RMTP`
* Red Bar: `RTBS`
* **Legend 2 (Error Metrics - Bottom Right of Bottom Row):**
* Green Hatched Bar: `RMTP e-`
* Green Solid Bar: `RMTP e+`
* Red Hatched Bar: `RTBS e-`
* Red Solid Bar: `RTBS e+`
* **Data Point Markers:** Black dots with vertical lines (likely representing mean and standard deviation or confidence intervals) are overlaid on each bar.
### Detailed Analysis
#### **Top Row: Accuracy (%)**
* **Mult ID-Hard (4M):**
* **Trend:** Accuracy is very low for `None` verification (~40%). It increases substantially for `Binary` and `Detailed` verification, with `RMTP` and `RTBS` performing similarly and outperforming `None`.
* **Data Points (Approximate):**
* `None` Verification: `None` method ≈ 40%.
* `Binary` Verification: `None` ≈ 70%, `RMTP` ≈ 78%, `RTBS` ≈ 78%.
* `Detailed` Verification: `None` ≈ 62%, `RMTP` ≈ 63%, `RTBS` ≈ 63%.
* **Mult OOD-Hard (4M):**
* **Trend:** Accuracy is near zero across all verification types and methods, indicating a complete failure to generalize to out-of-distribution data with the 4M model.
* **Data Points (Approximate):** All bars are at or below 5%.
* **Mult ID-Hard (16M):**
* **Trend:** Similar pattern to the 4M ID-Hard chart but with higher overall accuracy. `Binary` verification yields the highest performance, with `RMTP` and `RTBS` reaching near 80%.
* **Data Points (Approximate):**
* `None` Verification: `None` method ≈ 75%.
* `Binary` Verification: `None` ≈ 75%, `RMTP` ≈ 80%, `RTBS` ≈ 79%.
* `Detailed` Verification: `None` ≈ 75%, `RMTP` ≈ 77%, `RTBS` ≈ 77%.
* **Mult OOD-Hard (16M):**
* **Trend:** Accuracy remains very low, but shows a slight, visible increase compared to the 4M OOD model, particularly for `Detailed` verification with the `None` method.
* **Data Points (Approximate):** Most bars are below 5%. The highest point is `None` method with `Detailed` verification at ≈ 10%.
#### **Bottom Row: Error (%)**
* **Mult ID-Hard (4M):**
* **Trend:** Error is negligible for `None` verification. For `Binary` and `Detailed`, both `RMTP` and `RTBS` show significant error rates, with `RTBS` generally having slightly higher `e+` (overconfidence) error.
* **Data Points (Approximate):**
* `Binary` Verification: `RMTP e-` ≈ 55%, `RMTP e+` ≈ 15%, `RTBS e-` ≈ 55%, `RTBS e+` ≈ 60%.
* `Detailed` Verification: `RMTP e-` ≈ 10%, `RMTP e+` ≈ 20%, `RTBS e-` ≈ 15%, `RTBS e+` ≈ 30%.
* **Mult OOD-Hard (4M):**
* **Trend:** Error rates are high across the board for `Binary` and `Detailed` verification, consistent with the near-zero accuracy. `RTBS` shows particularly high `e+` error.
* **Data Points (Approximate):**
* `Binary` Verification: `RMTP e-` ≈ 20%, `RMTP e+` ≈ 65%, `RTBS e-` ≈ 20%, `RTBS e+` ≈ 70%.
* `Detailed` Verification: `RMTP e-` ≈ 10%, `RMTP e+` ≈ 60%, `RTBS e-` ≈ 10%, `RTBS e+` ≈ 65%.
* **Mult ID-Hard (16M):**
* **Trend:** Error rates are lower than the 4M model for ID data. `Binary` verification shows moderate error, while `Detailed` verification has lower error, especially for `RMTP`.
* **Data Points (Approximate):**
* `Binary` Verification: `RMTP e-` ≈ 10%, `RMTP e+` ≈ 12%, `RTBS e-` ≈ 8%, `RTBS e+` ≈ 10%.
* `Detailed` Verification: `RMTP e-` ≈ 5%, `RMTP e+` ≈ 8%, `RTBS e-` ≈ 5%, `RTBS e+` ≈ 22%.
* **Mult OOD-Hard (16M):**
* **Trend:** Error remains very high for OOD data, especially `e+` (overconfidence) error. `RTBS` with `Binary` verification shows the highest error in the entire set.
* **Data Points (Approximate):**
* `Binary` Verification: `RMTP e-` ≈ 40%, `RMTP e+` ≈ 85%, `RTBS e-` ≈ 40%, `RTBS e+` ≈ 90%.
* `Detailed` Verification: `RMTP e-` ≈ 10%, `RMTP e+` ≈ 55%, `RTBS e-` ≈ 10%, `RTBS e+` ≈ 65%.
### Key Observations
1. **Model Size Impact:** The 16M model consistently outperforms the 4M model in accuracy on in-distribution (ID) data and shows a marginal improvement on out-of-distribution (OOD) data.
2. **Verification Type Efficacy:** `Binary` and `Detailed` verification significantly boost accuracy over `None` for ID tasks. However, this benefit does not translate to OOD tasks.
3. **OOD Failure:** Both models fail catastrophically on OOD data, with accuracy near zero and very high error rates, particularly `e+` (overconfidence) error.
4. **Error Profile:** `RTBS` tends to have higher `e+` (overconfidence) error than `RMTP`, especially in challenging conditions (OOD, Binary verification).
5. **Trade-off:** There is a clear trade-off: applying reflective execution (`RMTP`/`RTBS`) with verification improves accuracy on ID data but introduces measurable error, primarily of the `e-` (underconfidence) type for `Binary` verification.
### Interpretation
This data suggests that reflective execution methods (`RMTP`, `RTBS`) are effective tools for improving the accuracy of language models on complex, in-distribution tasks when paired with verification steps. The performance gain is more pronounced with a larger model (16M vs. 4M). However, these methods do not solve the fundamental problem of model robustness to distribution shift. The near-zero accuracy and soaring overconfidence error (`e+`) on OOD data indicate that the models' internal confidence calibration breaks down completely when faced with unfamiliar data patterns, and the reflective mechanisms cannot compensate for this lack of generalization. The higher `e+` error for `RTBS` suggests it may be more prone to overconfident mistakes under uncertainty. The charts highlight a critical challenge in AI safety and reliability: techniques that enhance performance on known tasks may not confer robustness to novel situations, and can even exacerbate overconfidence in those scenarios.
DECODING INTELLIGENCE...