\n
## Scatter Plot: Confidence vs. Target Length for College Computer Science
### Overview
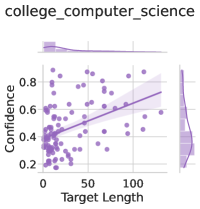
The image presents a scatter plot visualizing the relationship between "Target Length" and "Confidence" for data labeled as "college_computer_science". A regression line with a shaded confidence interval is overlaid on the scatter points. There are also two marginal distributions (histograms) displayed at the top and right sides of the main plot, showing the distributions of Target Length and Confidence respectively.
### Components/Axes
* **X-axis:** "Target Length" ranging from approximately 0 to 120.
* **Y-axis:** "Confidence" ranging from approximately 0.2 to 0.9.
* **Scatter Points:** Numerous purple dots representing individual data points.
* **Regression Line:** A purple line representing the trend of the data. The line slopes upwards from left to right.
* **Confidence Interval:** A shaded purple area around the regression line, indicating the uncertainty in the estimated trend.
* **Top Marginal Distribution:** A histogram showing the distribution of "Target Length". It appears to be skewed to the right, with a concentration of values near 0 and a tail extending towards higher values.
* **Right Marginal Distribution:** A histogram showing the distribution of "Confidence". It appears to be roughly symmetrical, with a peak around 0.5-0.6.
* **Title:** "college\_computer\_science" positioned at the top-left corner.
### Detailed Analysis
The scatter plot shows a positive correlation between "Target Length" and "Confidence". As "Target Length" increases, "Confidence" tends to increase as well. However, the relationship is not perfectly linear, and there is considerable scatter around the regression line.
* **Regression Line Trend:** The regression line slopes upwards, indicating a positive correlation.
* **Data Point Distribution:** The data points are clustered around the origin (low "Target Length", low "Confidence"). As "Target Length" increases, the points become more dispersed, with some points reaching high "Confidence" values.
* **Approximate Data Points (sampled):**
* Target Length = 0, Confidence ≈ 0.35
* Target Length = 25, Confidence ≈ 0.55
* Target Length = 50, Confidence ≈ 0.65
* Target Length = 75, Confidence ≈ 0.70
* Target Length = 100, Confidence ≈ 0.75
* **Top Marginal Distribution:** The distribution of "Target Length" is heavily skewed towards lower values. Approximately 70% of the data points have a "Target Length" below 25.
* **Right Marginal Distribution:** The distribution of "Confidence" is approximately normal, with a mean around 0.55 and a standard deviation of approximately 0.15.
### Key Observations
* The positive correlation between "Target Length" and "Confidence" suggests that longer targets are associated with higher confidence.
* The wide confidence interval around the regression line indicates that the relationship is not very strong, and there is considerable uncertainty in the estimated trend.
* The skewed distribution of "Target Length" suggests that most targets are relatively short.
* The marginal distributions provide additional information about the distributions of the individual variables.
### Interpretation
This data likely represents a model's confidence score in predicting or completing tasks of varying lengths within the domain of college-level computer science. The positive correlation suggests that the model performs better (higher confidence) on longer tasks. However, the scatter and the confidence interval indicate that task length is not the sole determinant of confidence; other factors likely play a role. The skewed distribution of target length suggests that the model is primarily evaluated on shorter tasks.
The marginal distributions provide context for the main scatter plot. The distribution of target length shows that the model is mostly tested on shorter targets, while the distribution of confidence shows that the model's confidence scores are generally moderate.
The data could be used to improve the model by focusing on tasks of varying lengths and identifying factors that contribute to higher confidence scores. It could also be used to assess the model's performance on different types of tasks and identify areas where it needs improvement.