## Line Chart: Success Rate vs. Problem Size by Difficulty
### Overview
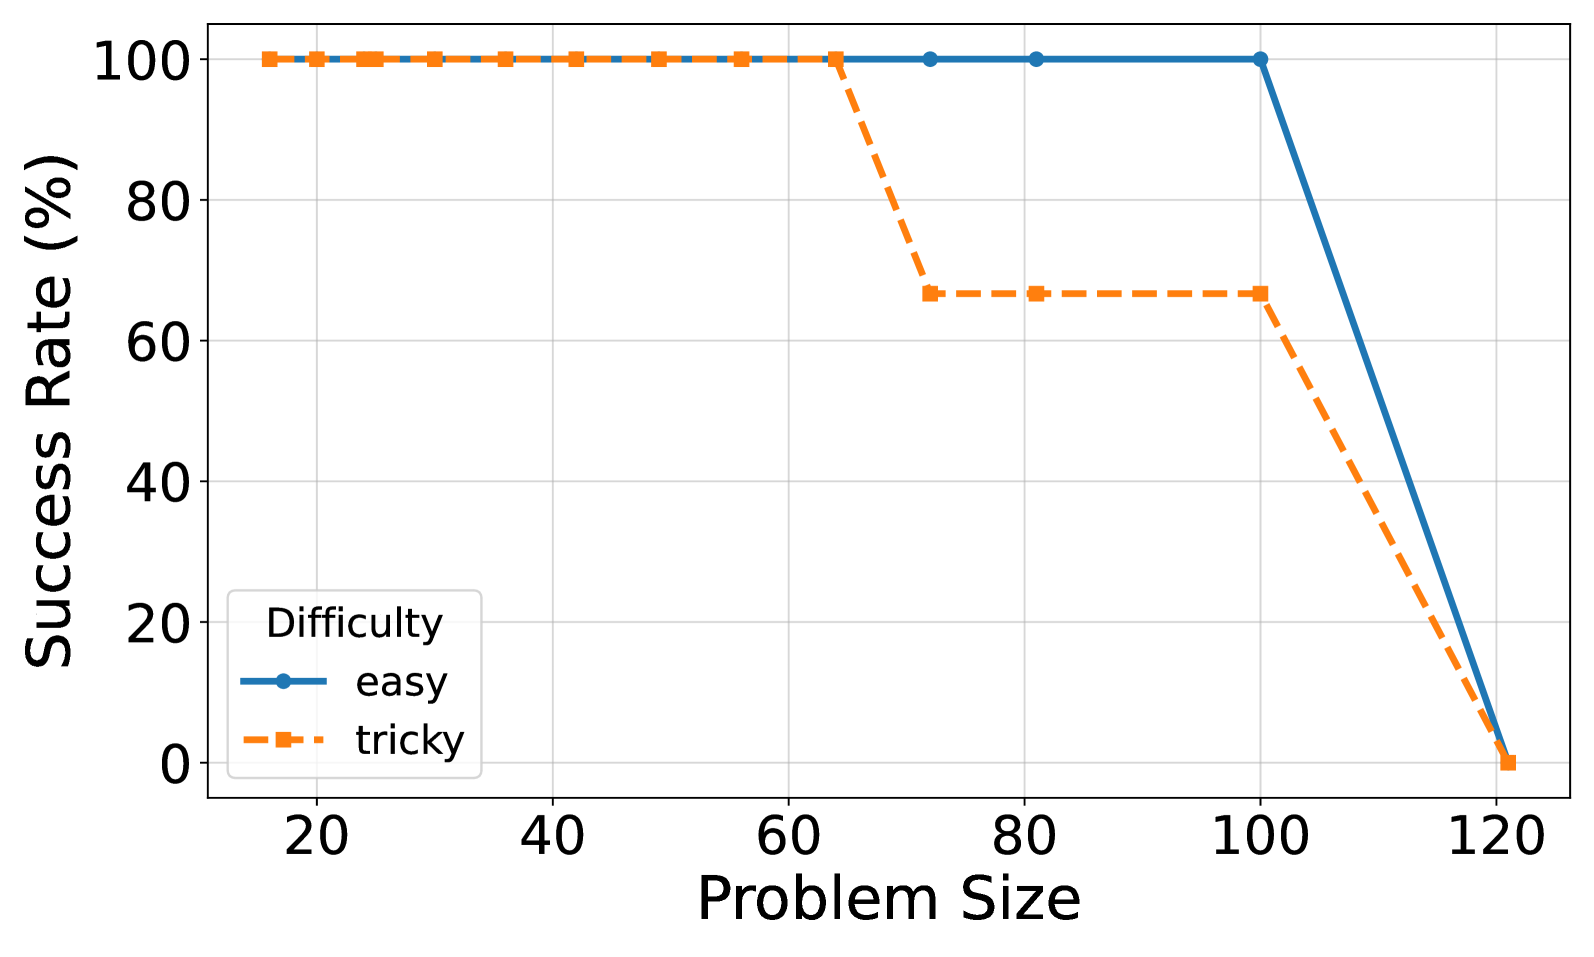
The image is a line chart that plots the success rate (in percentage) against the problem size for two different difficulty levels: "easy" and "tricky". The chart shows how the success rate changes as the problem size increases for each difficulty level.
### Components/Axes
* **Title:** There is no explicit title on the chart.
* **X-axis:**
* Label: "Problem Size"
* Scale: 20 to 120, with tick marks at intervals of 20 (20, 40, 60, 80, 100, 120)
* **Y-axis:**
* Label: "Success Rate (%)"
* Scale: 0 to 100, with tick marks at intervals of 20 (0, 20, 40, 60, 80, 100)
* **Legend:** Located in the bottom-left corner of the chart.
* "Difficulty"
* "easy": Represented by a solid blue line with circular markers.
* "tricky": Represented by a dashed orange line with square markers.
### Detailed Analysis
* **"easy" (blue line):**
* Trend: The success rate remains at 100% until a problem size of approximately 80. After that, it drops linearly to 0% at a problem size of 120.
* Data Points:
* Problem Size 20-80: Success Rate 100%
* Problem Size 100: Success Rate ~67%
* Problem Size 120: Success Rate 0%
* **"tricky" (orange dashed line):**
* Trend: The success rate remains at 100% until a problem size of approximately 60. It then drops to approximately 67% and remains constant until a problem size of 100, after which it drops linearly to 0% at a problem size of 120.
* Data Points:
* Problem Size 20-60: Success Rate 100%
* Problem Size 80-100: Success Rate ~67%
* Problem Size 120: Success Rate 0%
### Key Observations
* For smaller problem sizes (20-60), both difficulty levels have a 100% success rate.
* The "tricky" difficulty level experiences a drop in success rate earlier than the "easy" difficulty level.
* Both difficulty levels reach a 0% success rate at a problem size of 120.
* The "easy" difficulty maintains a 100% success rate for a longer range of problem sizes compared to the "tricky" difficulty.
### Interpretation
The chart demonstrates the relationship between problem size and success rate for different difficulty levels. It suggests that as the problem size increases, the success rate decreases, and this decrease is more pronounced for the "tricky" difficulty level. The "easy" difficulty level is more resilient to increasing problem sizes, maintaining a high success rate for a longer range. The data indicates that the "tricky" problems become difficult at a smaller problem size than the "easy" problems. The eventual convergence to 0% success rate for both difficulty levels at a problem size of 120 suggests a limit to the problem-solving capability, regardless of difficulty, as the problem size becomes sufficiently large.