# Technical Data Extraction: Principal Component Analysis (PCA) of Experts
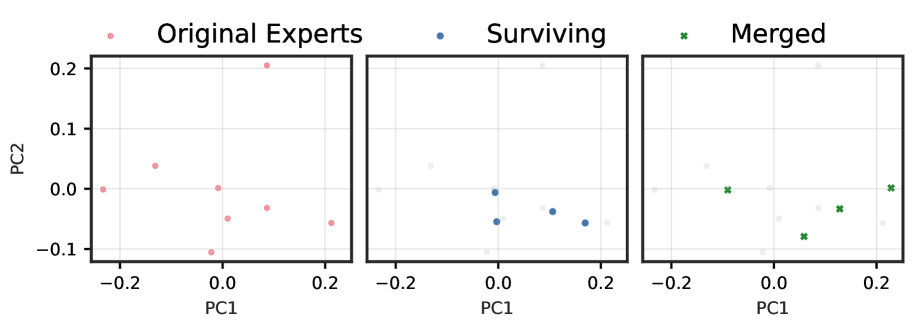
This image consists of three side-by-side scatter plots representing a Principal Component Analysis (PCA) of "Experts" in a model. The plots visualize the distribution and transformation of these experts across two dimensions: **PC1** (x-axis) and **PC2** (y-axis).
## 1. Global Chart Metadata
* **X-Axis Label:** PC1 (Common to all three plots)
* **X-Axis Range:** Approximately -0.25 to 0.25
* **X-Axis Markers:** -0.2, 0, 0.2
* **Y-Axis Label:** PC2 (Shown on the leftmost plot)
* **Y-Axis Range:** Approximately -0.12 to 0.22
* **Y-Axis Markers:** -0.1, 0.0, 0.1, 0.2
* **Grid:** Light gray grid lines are present in all plots.
---
## 2. Individual Plot Analysis
### Plot 1: Original Experts
* **Legend Label:** Original Experts
* **Marker Style:** Light red/pink solid circles
* **Data Points:** 8 distinct points representing the initial state of the experts.
* **Approximate Coordinates (PC1, PC2):**
1. (-0.23, 0.00)
2. (-0.13, 0.04)
3. (-0.02, -0.11)
4. (-0.01, 0.00)
5. (0.01, -0.05)
6. (0.08, 0.21)
7. (0.09, -0.03)
8. (0.21, -0.06)
### Plot 2: Surviving
* **Legend Label:** Surviving
* **Marker Style:** Blue solid circles (Original points are shown as faint gray background markers).
* **Data Points:** 4 active points. These represent the experts that were retained without being merged.
* **Approximate Coordinates (PC1, PC2):**
1. (-0.01, -0.01)
2. (0.00, -0.06)
3. (0.11, -0.04)
4. (0.17, -0.06)
### Plot 3: Merged
* **Legend Label:** Merged
* **Marker Style:** Green "x" marks (Original points are shown as faint gray background markers).
* **Data Points:** 4 active points. These represent new expert positions resulting from the merging of original experts.
* **Approximate Coordinates (PC1, PC2):**
1. (-0.09, 0.00)
2. (0.06, -0.08)
3. (0.13, -0.03)
4. (0.23, 0.00)
---
## 3. Summary of Trends and Observations
* **Dimensionality Reduction:** The visualization shows how a set of 8 original experts is processed into a new set of 8 entities: 4 "Surviving" (original positions kept) and 4 "Merged" (new positions created).
* **Spatial Distribution:**
* The **Original Experts** are widely dispersed across the PC1/PC2 plane.
* The **Surviving** experts are clustered more toward the center and right-center of the PC1 axis.
* The **Merged** experts (green 'x') appear to occupy spaces that were previously between or near original expert clusters, particularly filling in the far right and left-center of the PC1 axis.