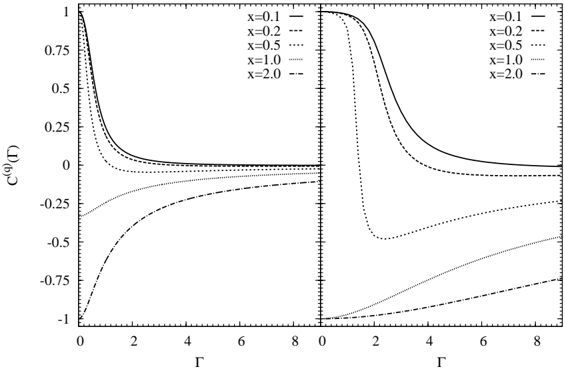
## Line Chart: C<sup>(q)</sup>(Γ) vs. Γ for different values of x
### Overview
The image presents two line charts side-by-side, both plotting C<sup>(q)</sup>(Γ) against Γ. The charts display the relationship between these variables for different constant values of 'x', ranging from 0.1 to 2.0. The left chart shows the behavior of the function from Γ = 0 to 8, while the right chart appears to focus on a specific region where the function exhibits more rapid changes.
### Components/Axes
* **X-axis (Horizontal):** Γ (Gamma), ranging from 0 to 8 in both charts.
* **Y-axis (Vertical):** C<sup>(q)</sup>(Γ), ranging from -1 to 1 in both charts.
* **Legend (Top-Right of each chart):**
* x = 0.1 (Solid Line)
* x = 0.2 (Dashed Line)
* x = 0.5 (Dotted Line)
* x = 1.0 (Dash-Dot Line)
* x = 2.0 (Long Dash Line)
### Detailed Analysis
**Left Chart:**
* **x = 0.1 (Solid Line):** Starts at approximately 0.95 at Γ = 0 and decreases rapidly, approaching 0 at Γ = 4 and remaining close to 0 for Γ > 4.
* **x = 0.2 (Dashed Line):** Starts at approximately 0.8 at Γ = 0 and decreases, approaching 0 at Γ = 4 and remaining close to 0 for Γ > 4.
* **x = 0.5 (Dotted Line):** Starts at approximately 0.3 at Γ = 0 and decreases, becoming negative around Γ = 1, reaching approximately -0.25 at Γ = 2, and then slowly approaching 0 for Γ > 4.
* **x = 1.0 (Dash-Dot Line):** Starts at approximately -0.3 at Γ = 0 and increases, approaching 0 at Γ = 4 and remaining close to 0 for Γ > 4.
* **x = 2.0 (Long Dash Line):** Starts at approximately -1 at Γ = 0 and increases, approaching 0 at Γ = 4 and remaining close to 0 for Γ > 4.
**Right Chart:**
* **x = 0.1 (Solid Line):** Starts at approximately 1 and decreases rapidly, approaching 0.1 at Γ = 4 and remaining close to 0.1 for Γ > 4.
* **x = 0.2 (Dashed Line):** Starts at approximately 1 and decreases rapidly, approaching 0 at Γ = 4 and remaining close to 0 for Γ > 4.
* **x = 0.5 (Dotted Line):** Starts at approximately -0.9 at Γ = 0 and increases rapidly, approaching 0 at Γ = 4 and remaining close to 0 for Γ > 4.
* **x = 1.0 (Dash-Dot Line):** Starts at approximately -0.9 at Γ = 0 and increases rapidly, approaching 0 at Γ = 4 and remaining close to 0 for Γ > 4.
* **x = 2.0 (Long Dash Line):** Starts at approximately -0.9 at Γ = 0 and increases rapidly, approaching 0 at Γ = 4 and remaining close to 0 for Γ > 4.
### Key Observations
* For smaller values of 'x' (0.1 and 0.2), C<sup>(q)</sup>(Γ) starts positive and decreases towards zero as Γ increases.
* For larger values of 'x' (0.5, 1.0, and 2.0), C<sup>(q)</sup>(Γ) starts negative and increases towards zero as Γ increases.
* The right chart shows a zoomed-in view of the initial behavior of the curves, highlighting the rapid changes near Γ = 0.
* All curves tend to converge towards zero as Γ increases, suggesting a limiting behavior of the function.
### Interpretation
The charts illustrate how the function C<sup>(q)</sup>(Γ) behaves as Γ varies, for different fixed values of 'x'. The data suggests that 'x' influences the initial value and the direction of change of C<sup>(q)</sup>(Γ). Smaller 'x' values lead to positive initial values and a decreasing trend, while larger 'x' values lead to negative initial values and an increasing trend. The convergence of all curves towards zero as Γ increases indicates that the influence of 'x' diminishes as Γ becomes large. The right chart emphasizes the sensitivity of C<sup>(q)</sup>(Γ) to changes in Γ, especially when Γ is small. The relationship between 'x' and C<sup>(q)</sup>(Γ) appears to be inversely proportional at Γ = 0.