## Diagram: Region Decomposition - Exchange Pricing
### Overview
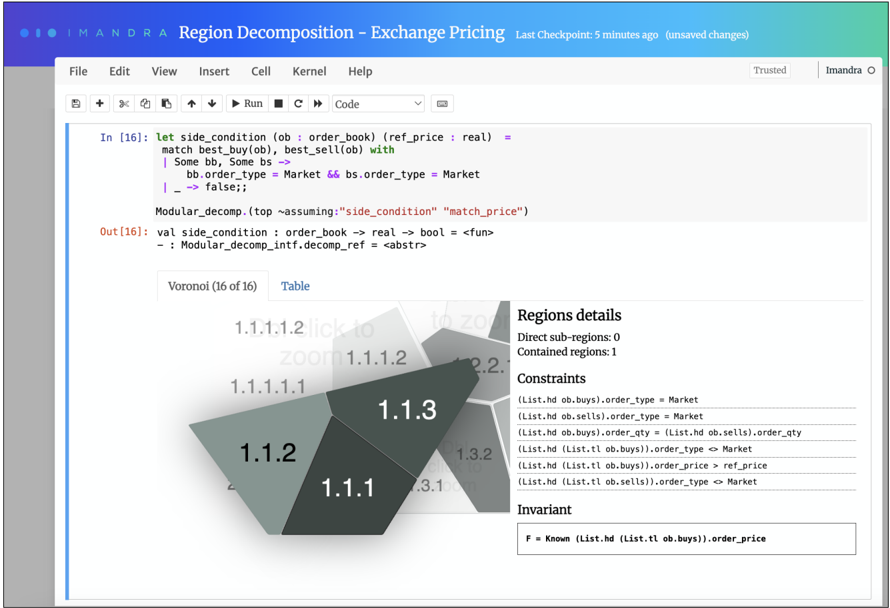
The image displays a screenshot of a coding environment (likely Jupyter Notebook) with a visualization of a Voronoi diagram alongside code snippets and associated details. The diagram appears to represent a region decomposition related to exchange pricing, with the code providing context for the visualization. The interface indicates the notebook is named "Region Decomposition - Exchange Pricing" and has unsaved changes.
### Components/Axes
The screenshot contains the following key components:
* **Header:** Displays the notebook title, last checkpoint time, and save status.
* **Code Editor:** Contains code snippets related to `side_condition` and `Modular_decomp`.
* **Voronoi Diagram:** A visual representation of the region decomposition.
* **Table/Tab Navigation:** "Voronoi (16 of 16)" and "Table" tabs are visible.
* **Regions Details:** A text box providing information about the regions in the diagram.
* **Constraints:** A list of constraints related to the decomposition.
* **Invariant:** A statement defining an invariant related to the decomposition.
The Voronoi diagram itself doesn't have explicit axes in the traditional sense, but it represents a partitioning of a space based on distance to points. The diagram is labeled with region identifiers (e.g., 1.1.1.1, 1.1.2, 1.1.3).
### Detailed Analysis or Content Details
**Code Snippets:**
* `In [16]: let side_condition (ob : order_book) (ref_price : real) = match best_buy(ob), best_sell(ob) with | Some bb, Some bs -> ...` This code defines a function `side_condition` that takes an order book and a reference price as input. It appears to match the best buy and best sell orders.
* `Modular_decomp.(top =assuming:"side_condition" "match_price")` This line calls a function `Modular_decomp` with an assumption related to `side_condition` and `match_price`.
* `Out[16]: val side_condition : order_book -> bool <fun> - : Modular_decomp_intf.decomp_ref = <abstr>` This line shows the output of the `side_condition` function, indicating it returns a boolean value.
**Voronoi Diagram:**
The diagram shows a Voronoi tessellation with 16 regions. The regions are labeled with hierarchical identifiers. The colors of the regions vary, with shades of purple and gray. The diagram has a "click to zoom" indicator.
* Region 1.1.1.1 is located in the bottom-left corner.
* Region 1.1.1.2 is adjacent to 1.1.1.1 and slightly above and to the right.
* Region 1.1.2 is located to the right of 1.1.1.1 and 1.1.1.2.
* Region 1.1.3 is located above 1.1.1.2.
* Region 1.3.1 is located to the right of 1.1.3.
* Region 1.3.2 is located to the right of 1.3.1.
* Region 2.2 is located to the upper-right of the diagram.
**Regions Details:**
* Direct sub-regions: 0
* Contained regions: 1
**Constraints:**
* `(List.hd ob.buys).order_type < Market`
* `(List.hd ob.sells).order_type < Market`
* `(List.hd ob.buys).order_qty < (List.hd ob.sells).order_qty`
* `(List.hd (List.tl ob.buys)).order_type < Market`
* `(List.hd (List.tl ob.sells)).order_price < Market`
**Invariant:**
* `F = Known (List.tl (List.hd ob.buys)).order_price`
### Key Observations
* The code and diagram are related to order book analysis and exchange pricing.
* The Voronoi diagram represents a decomposition of the order book space based on certain conditions.
* The constraints define conditions that must be met for the decomposition.
* The invariant defines a property that remains constant throughout the decomposition.
* The diagram is interactive, allowing users to zoom into specific regions.
### Interpretation
The image demonstrates a method for decomposing an order book based on the `side_condition` function. The Voronoi diagram visually represents the regions created by this decomposition. Each region likely corresponds to a specific set of order book states that satisfy the defined constraints. The constraints themselves relate to order types and quantities, suggesting the decomposition is based on the characteristics of the orders in the book. The invariant provides a stable property that can be used to analyze the decomposition.
The use of a Voronoi diagram suggests that the decomposition is based on proximity or distance in the order book space. The code snippets and details provide a formal definition of the decomposition process, while the diagram offers a visual representation that can aid in understanding the relationships between different order book states. The "click to zoom" functionality indicates that the diagram is intended for interactive exploration and analysis. The overall goal appears to be to gain insights into the structure and dynamics of exchange pricing by decomposing the order book into meaningful regions.