## Line Chart: RewardBench Performance vs. Thinking Budget
### Overview
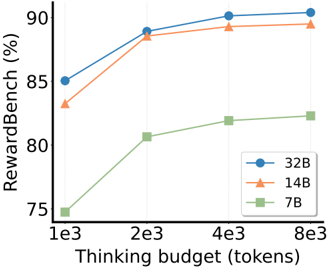
The chart illustrates the relationship between "Thinking budget (tokens)" and "RewardBench (%)" for three model sizes (32B, 14B, 7B). It shows how performance improves as the thinking budget increases, with distinct trends for each model size.
### Components/Axes
- **X-axis**: Thinking budget (tokens) in scientific notation (1e3, 2e3, 4e3, 8e3).
- **Y-axis**: RewardBench (%) ranging from 75% to 90%.
- **Legend**: Located in the bottom-right corner, mapping colors to model sizes:
- Blue (circle markers): 32B
- Orange (triangle markers): 14B
- Green (square markers): 7B
### Detailed Analysis
1. **32B Model (Blue Line)**:
- Data points: 85% (1e3), 89% (2e3), 90% (4e3), 90% (8e3).
- Trend: Steady upward slope, plateauing near 90% after 4e3 tokens.
2. **14B Model (Orange Line)**:
- Data points: 83% (1e3), 89% (2e3), 89.5% (4e3), 89.8% (8e3).
- Trend: Sharp initial increase, then gradual flattening.
3. **7B Model (Green Line)**:
- Data points: 75% (1e3), 81% (2e3), 82% (4e3), 82.5% (8e3).
- Trend: Steep early growth, followed by minimal improvement.
### Key Observations
- The 32B model consistently outperforms others across all token budgets.
- The 7B model shows the largest relative improvement (from 75% to 82.5%) but remains below the 14B and 32B models.
- All models exhibit diminishing returns as the token budget increases beyond 4e3.
### Interpretation
The data suggests that larger models (e.g., 32B) achieve higher RewardBench scores with greater computational resources (tokens). The 7B model demonstrates significant efficiency gains at lower budgets but cannot match the performance of larger models even with increased resources. This highlights a trade-off between model size and scalability, where bigger models leverage additional tokens more effectively. The plateauing trends at higher token budgets imply diminishing marginal returns for all models beyond a certain point.