## Bar Chart: Question Success by GAIA Categories
### Overview
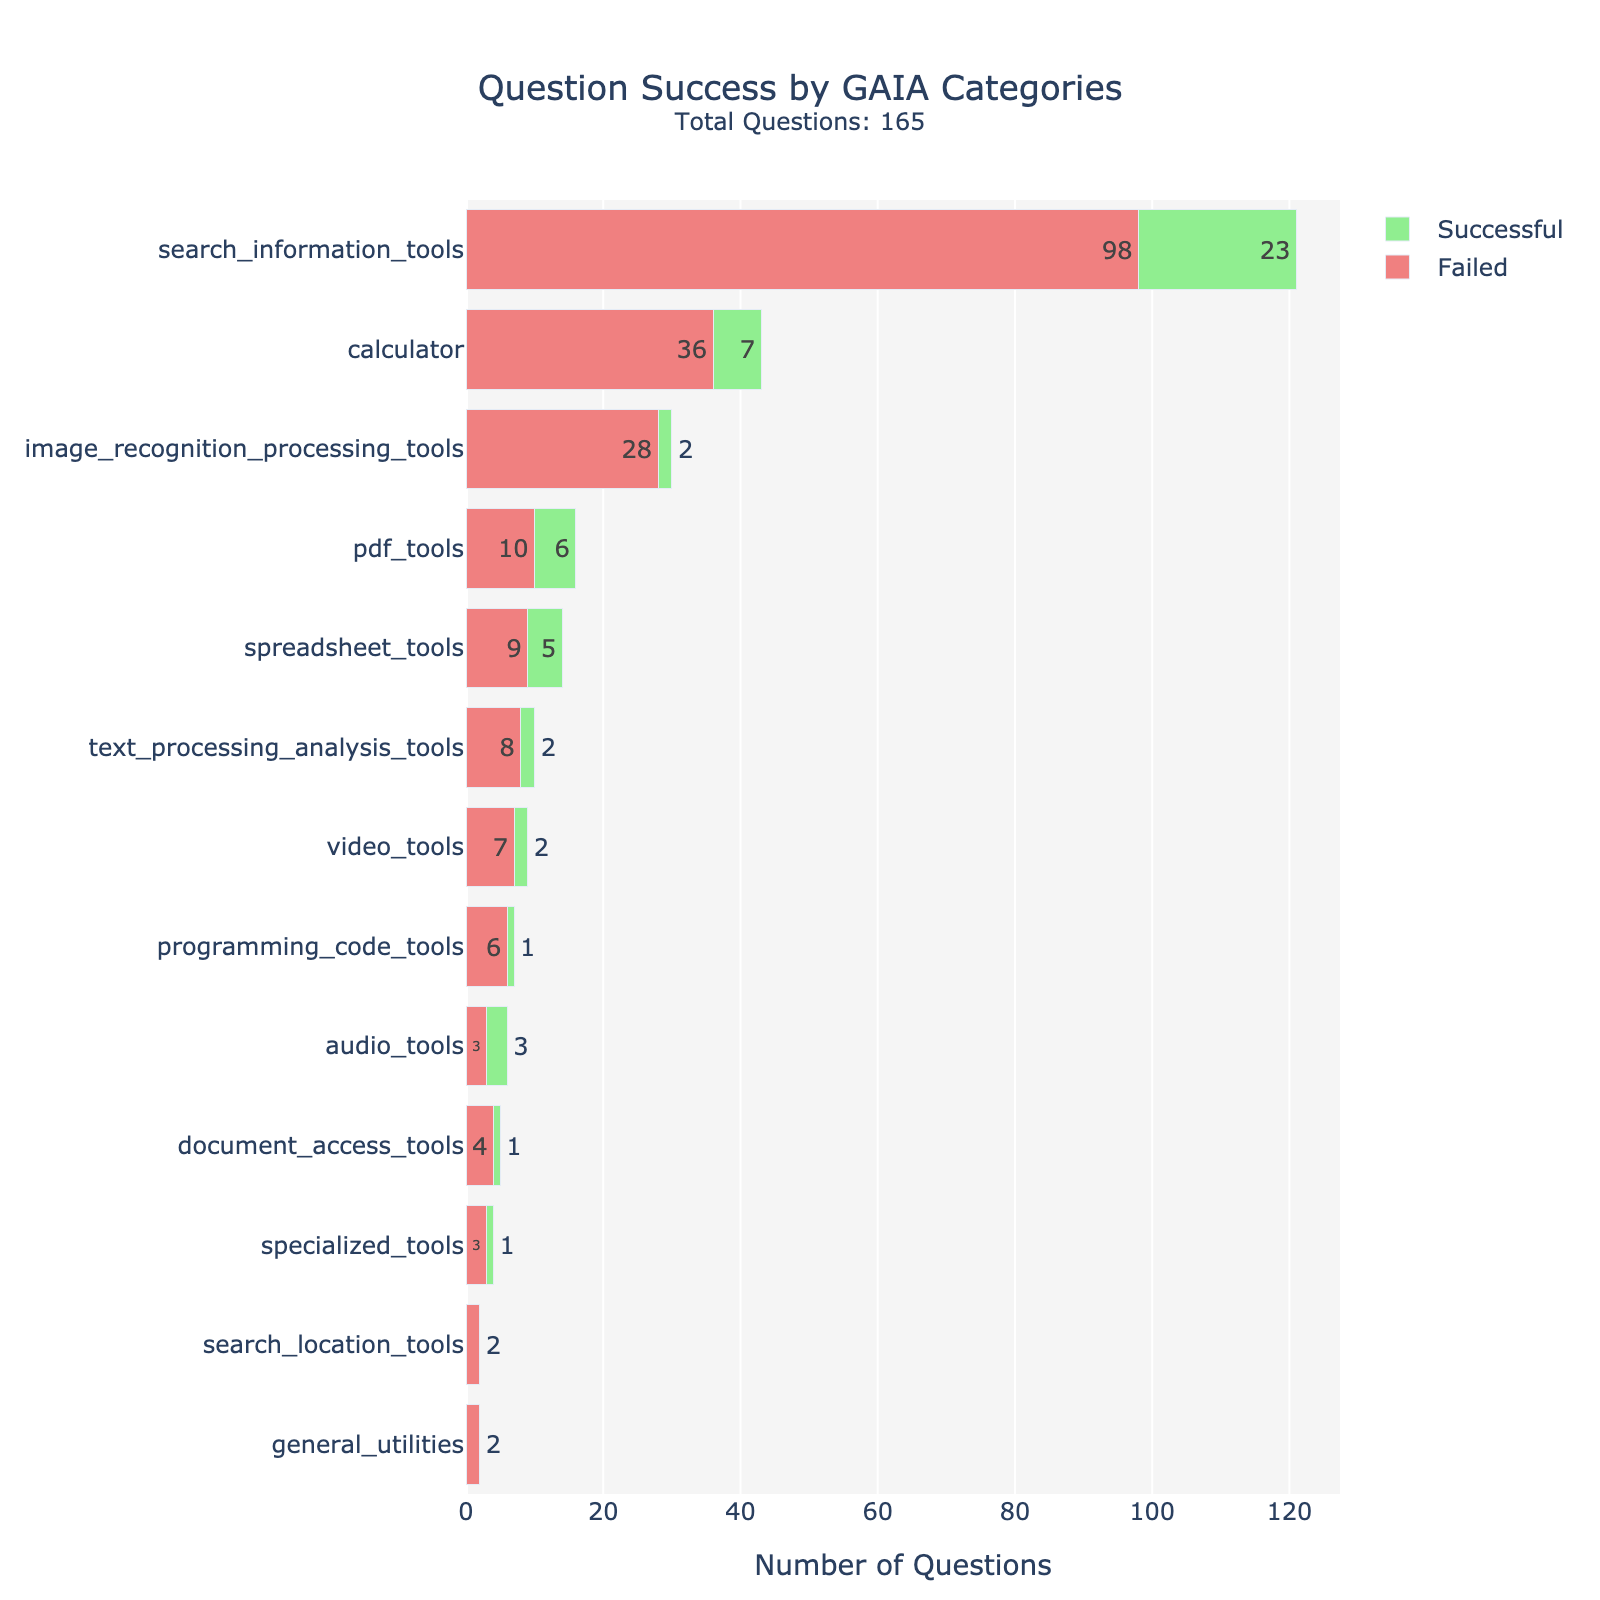
The image is a horizontal bar chart displaying the success rate of questions categorized by GAIA tools. The chart compares the number of successful and failed questions for each tool category. The total number of questions is 165.
### Components/Axes
* **Title:** Question Success by GAIA Categories
* **Subtitle:** Total Questions: 165
* **X-axis:** Number of Questions, ranging from 0 to 120.
* **Y-axis:** GAIA Categories (list below)
* **Legend:** Located in the top-right corner.
* Successful (Green)
* Failed (Red)
* **Categories (Y-axis):**
* search\_information\_tools
* calculator
* image\_recognition\_processing\_tools
* pdf\_tools
* spreadsheet\_tools
* text\_processing\_analysis\_tools
* video\_tools
* programming\_code\_tools
* audio\_tools
* document\_access\_tools
* specialized\_tools
* search\_location\_tools
* general\_utilities
### Detailed Analysis
The chart presents the number of successful and failed questions for each GAIA category. The values are displayed directly on the bars.
* **search\_information\_tools:** 98 Failed, 23 Successful
* **calculator:** 36 Failed, 7 Successful
* **image\_recognition\_processing\_tools:** 28 Failed, 2 Successful
* **pdf\_tools:** 10 Failed, 6 Successful
* **spreadsheet\_tools:** 9 Failed, 5 Successful
* **text\_processing\_analysis\_tools:** 8 Failed, 2 Successful
* **video\_tools:** 7 Failed, 2 Successful
* **programming\_code\_tools:** 6 Failed, 1 Successful
* **audio\_tools:** 3 Failed, 3 Successful
* **document\_access\_tools:** 4 Failed, 1 Successful
* **specialized\_tools:** 3 Failed, 1 Successful
* **search\_location\_tools:** 2 Failed, 2 Successful (Note: The successful bar is not visible, implying a very small value or zero)
* **general\_utilities:** 2 Failed, 2 Successful (Note: The successful bar is not visible, implying a very small value or zero)
### Key Observations
* The "search\_information\_tools" category has the highest number of questions, with a significant number of failed questions.
* The ratio of failed to successful questions varies across categories. Some categories, like "audio\_tools", have a relatively balanced ratio.
* "search\_location\_tools" and "general\_utilities" have very few questions overall.
### Interpretation
The chart provides insights into the performance of different GAIA tool categories based on question success rates. The data suggests that some tool categories, such as "search\_information\_tools," may require further attention due to the high number of failed questions. The balanced ratio in "audio\_tools" indicates a potentially well-performing category. The low question counts in "search\_location\_tools" and "general\_utilities" might suggest these tools are less frequently used or tested.