## Horizontal Bar Chart: Compliance by Provider (Weighted)
### Overview
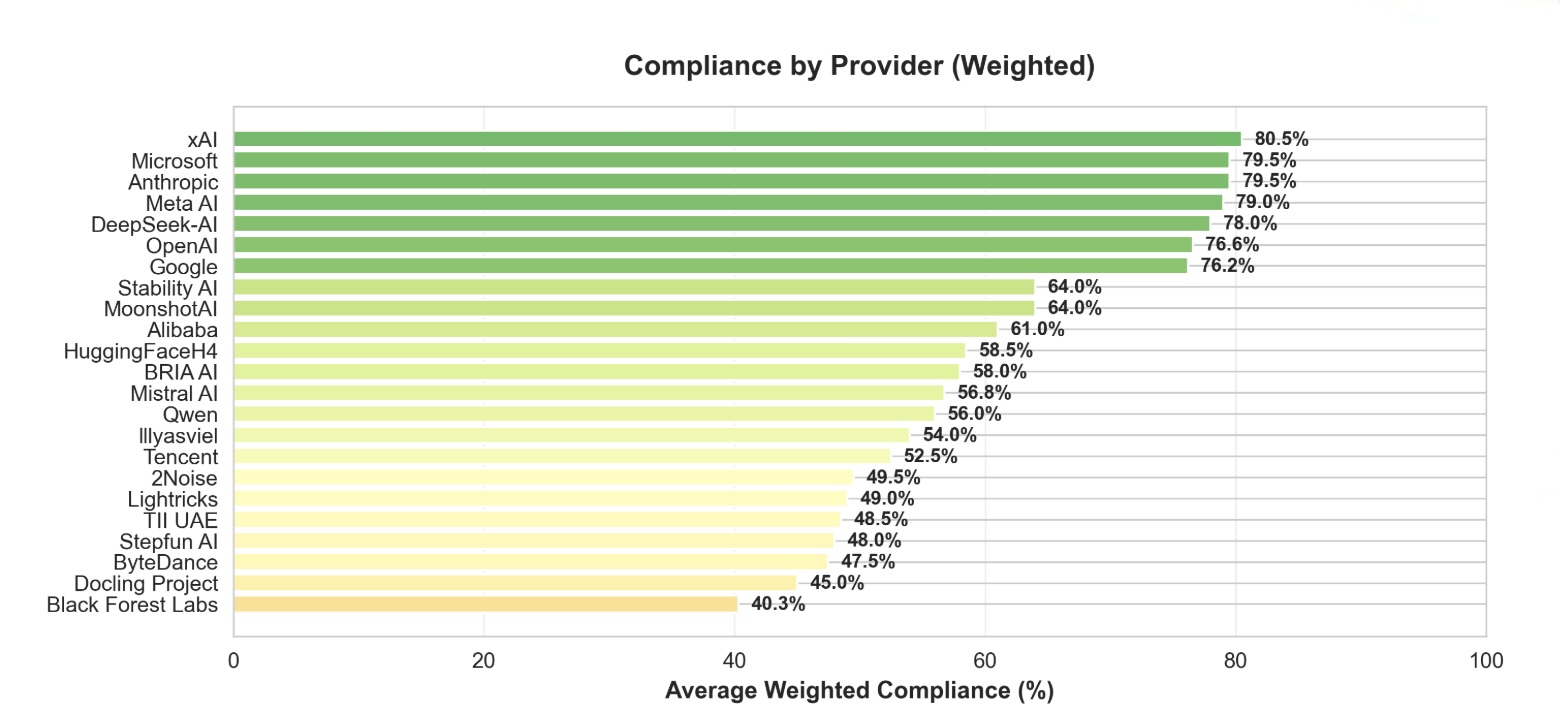
This image displays a horizontal bar chart titled "Compliance by Provider (Weighted)". It ranks 22 artificial intelligence companies or projects based on a metric called "Average Weighted Compliance (%)". The chart uses a color gradient from dark green (highest compliance) to light yellow (lowest compliance) to visually group performance tiers.
### Components/Axes
* **Chart Title:** "Compliance by Provider (Weighted)" - located at the top center.
* **Y-Axis (Vertical):** Lists the names of the AI providers. The list is ordered from highest compliance at the top to lowest at the bottom.
* **X-Axis (Horizontal):** Labeled "Average Weighted Compliance (%)". The scale runs from 0 to 100, with major tick marks and labels at 0, 20, 40, 60, 80, and 100.
* **Data Representation:** Horizontal bars extend from the y-axis to the right. The length of each bar corresponds to the compliance percentage, which is also written numerically at the end of each bar.
* **Color Legend (Implied):** There is no separate legend box. The color of the bars serves as an implicit legend:
* **Dark Green:** Highest compliance tier (approximately 76% and above).
* **Medium Green:** High compliance tier (approximately 64% to 76%).
* **Light Green/Yellow:** Mid-tier compliance (approximately 56% to 64%).
* **Pale Yellow:** Lower compliance tier (approximately 40% to 56%).
### Detailed Analysis
The chart presents the following data points, listed from top (highest) to bottom (lowest). The visual trend is a clear, stepwise decrease in bar length and a shift in color from dark green to pale yellow as you move down the list.
| Provider | Average Weighted Compliance (%) | Bar Color (Approximate) |
| :--- | :--- | :--- |
| xAI | 80.5% | Dark Green |
| Microsoft | 79.5% | Dark Green |
| Anthropic | 79.5% | Dark Green |
| Meta AI | 79.0% | Dark Green |
| DeepSeek-AI | 78.0% | Dark Green |
| OpenAI | 76.6% | Dark Green |
| Google | 76.2% | Dark Green |
| Stability AI | 64.0% | Medium Green |
| MoonshotAI | 64.0% | Medium Green |
| Alibaba | 61.0% | Light Green |
| HuggingFaceH4 | 58.5% | Light Green |
| BRIA AI | 58.0% | Light Green |
| Mistral AI | 56.8% | Light Green |
| Qwen | 56.0% | Light Green |
| Illyasviel | 54.0% | Pale Yellow |
| Tencent | 52.5% | Pale Yellow |
| 2Noise | 49.5% | Pale Yellow |
| Lightricks | 49.0% | Pale Yellow |
| TII UAE | 48.5% | Pale Yellow |
| Stepfun AI | 48.0% | Pale Yellow |
| ByteDance | 47.5% | Pale Yellow |
| Docling Project | 45.0% | Pale Yellow |
| Black Forest Labs | 40.3% | Pale Yellow |
### Key Observations
1. **Top Tier Clustering:** Seven providers (xAI through Google) form a distinct top cluster with compliance scores between 76.2% and 80.5%. The differences within this group are small (max 4.3 percentage points).
2. **Significant Drop-off:** There is a notable 12.2 percentage point gap between the lowest of the top tier (Google at 76.2%) and the highest of the next tier (Stability AI and MoonshotAI at 64.0%).
3. **Gradual Decline:** Below the top tier, the decline in compliance scores is more gradual, with a steady decrease from 64.0% down to 40.3%.
4. **Color-Coded Performance:** The color gradient effectively segments the providers into performance bands, making the tier structure immediately apparent.
5. **Lowest Performer:** Black Forest Labs has the lowest recorded compliance at 40.3%, which is less than half the score of the top performer, xAI (80.5%).
### Interpretation
This chart provides a comparative snapshot of how different AI providers perform against a "weighted compliance" standard. The data suggests a highly competitive and relatively homogeneous top tier, where leading companies are achieving very similar, high levels of compliance. The significant gap after this group indicates a clear stratification in the market, possibly reflecting differences in resources, maturity, or strategic focus on compliance metrics.
The "weighted" nature of the compliance score implies that not all compliance factors are treated equally; some criteria likely carry more importance in the calculation. The chart does not specify what these criteria are (e.g., safety protocols, content moderation, regulatory adherence, transparency). Therefore, while it effectively ranks providers, the underlying reasons for the disparities require additional context about the evaluation methodology. The visualization is effective for quick benchmarking but would be most powerful when accompanied by a definition of the compliance metrics used.