## Chart Type: Comparative Line Graphs
### Overview
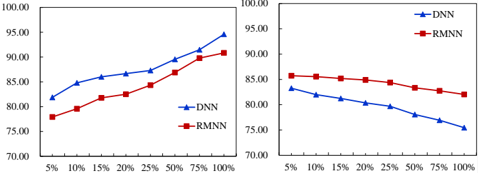
The image presents two line graphs comparing the performance of two models, DNN (Deep Neural Network) and RMNN (Recurrent Memory Neural Network), across varying data percentages. The left graph shows performance increasing with data percentage, while the right graph shows performance decreasing with data percentage.
### Components/Axes
* **Y-axis (both graphs):** Performance, ranging from 70.00 to 100.00. Increments of 5.00 are marked.
* **X-axis (both graphs):** Data percentage, with markers at 5%, 10%, 15%, 20%, 25%, 50%, 75%, and 100%.
* **Legend (both graphs):**
* Blue line with triangle markers: DNN
* Red line with square markers: RMNN
### Detailed Analysis
**Left Graph (Increasing Performance):**
* **DNN (Blue):** The DNN line slopes upward.
* 5%: ~82.00
* 10%: ~84.50
* 15%: ~86.00
* 20%: ~86.50
* 25%: ~87.00
* 50%: ~88.00
* 75%: ~92.00
* 100%: ~95.00
* **RMNN (Red):** The RMNN line also slopes upward, but generally remains below the DNN line.
* 5%: ~78.00
* 10%: ~80.00
* 15%: ~82.00
* 20%: ~83.00
* 25%: ~83.00
* 50%: ~87.00
* 75%: ~90.00
* 100%: ~91.00
**Right Graph (Decreasing Performance):**
* **DNN (Blue):** The DNN line slopes downward.
* 5%: ~83.00
* 10%: ~82.00
* 15%: ~81.50
* 20%: ~81.00
* 25%: ~80.50
* 50%: ~78.00
* 75%: ~77.00
* 100%: ~76.00
* **RMNN (Red):** The RMNN line also slopes downward, but generally remains above the DNN line.
* 5%: ~86.00
* 10%: ~85.50
* 15%: ~85.50
* 20%: ~85.00
* 25%: ~85.00
* 50%: ~83.50
* 75%: ~83.00
* 100%: ~82.00
### Key Observations
* In the left graph, DNN consistently outperforms RMNN. Both models improve as the data percentage increases.
* In the right graph, RMNN consistently outperforms DNN. Both models degrade as the data percentage increases.
* The performance difference between DNN and RMNN is more pronounced in the left graph than in the right graph.
### Interpretation
The two graphs likely represent performance under different conditions or tasks. The left graph suggests a scenario where more data benefits both models, with DNN being more efficient at leveraging the increased data. The right graph suggests a scenario where more data introduces noise or complexity that degrades performance, with RMNN being more robust to this degradation. The specific nature of these conditions or tasks would require additional context.