# Technical Data Extraction: N-gram Diversity Analysis
## 1. General Overview
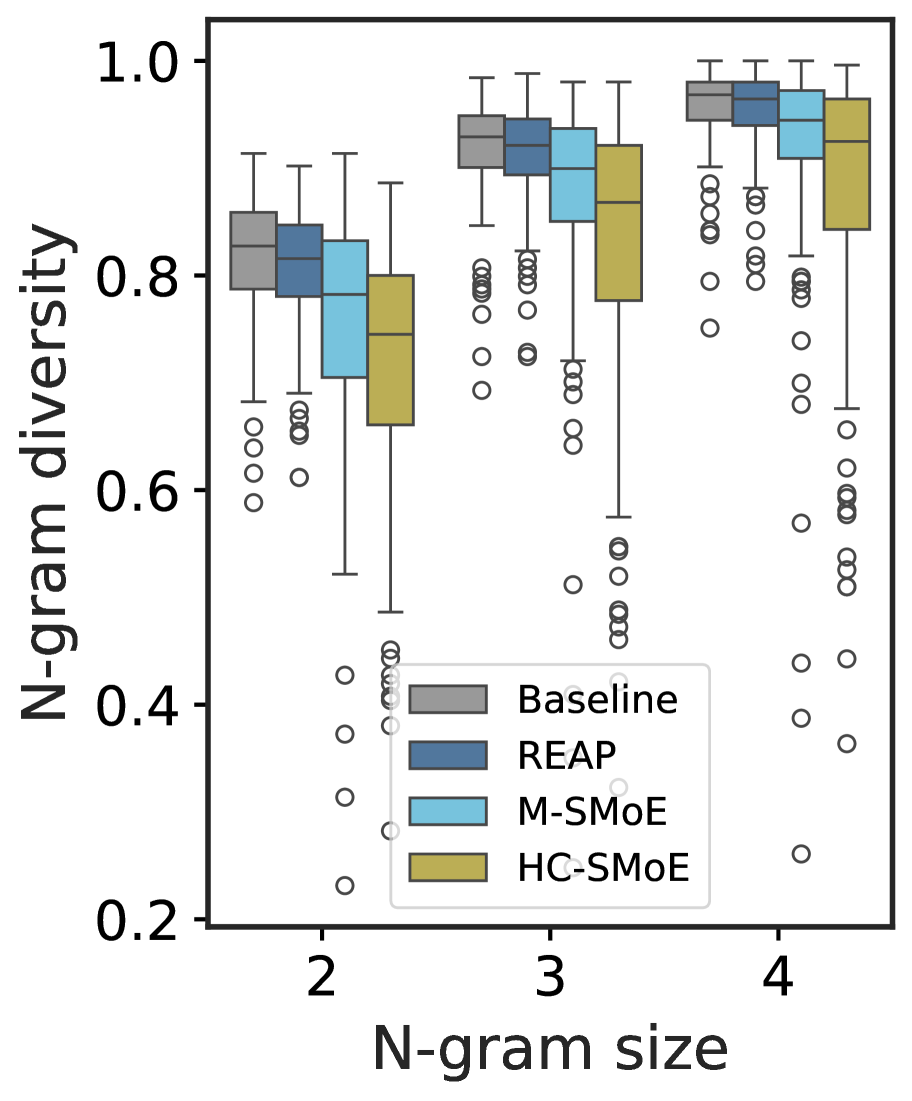
This image is a grouped box plot illustrating the distribution of **N-gram diversity** scores across four different models/methods, evaluated at three different **N-gram sizes**.
## 2. Axis Information
* **Y-Axis Title:** N-gram diversity
* **Y-Axis Scale:** Linear, ranging from 0.2 to 1.0 (markers at 0.2, 0.4, 0.6, 0.8, 1.0).
* **X-Axis Title:** N-gram size
* **X-Axis Categories:** 2, 3, and 4.
## 3. Legend and Color Coding
The chart compares four distinct methods, represented by specific colors:
* **Baseline:** Grey
* **REAP:** Dark Blue/Slate
* **M-SMoE:** Light Blue/Cyan
* **HC-SMoE:** Olive Green/Gold
## 4. Data Trends and Observations
The data is grouped by N-gram size (2, 3, and 4). Within each group, the models are presented in the order listed in the legend (Baseline, REAP, M-SMoE, HC-SMoE).
### Group 1: N-gram size = 2
* **Baseline:** Median ~0.83. Tightest distribution among the four.
* **REAP:** Median ~0.82. Slightly lower than Baseline with a few outliers below 0.7.
* **M-SMoE:** Median ~0.78. Larger interquartile range (IQR) than REAP, with outliers extending down to ~0.4.
* **HC-SMoE:** Median ~0.75. Lowest median in this group, with the largest IQR and outliers extending down to ~0.25.
### Group 2: N-gram size = 3
* **Baseline:** Median ~0.93. High diversity with outliers between 0.7 and 0.8.
* **REAP:** Median ~0.92. Very similar to Baseline.
* **M-SMoE:** Median ~0.90. Slightly lower median and wider IQR than REAP.
* **HC-SMoE:** Median ~0.87. Lowest median in the group, significantly wider IQR, and numerous outliers extending down to ~0.3.
### Group 3: N-gram size = 4
* **Baseline:** Median ~0.97. Highest diversity scores overall.
* **REAP:** Median ~0.96. Nearly identical to Baseline.
* **M-SMoE:** Median ~0.94. High diversity but with a noticeable spread of outliers down to ~0.4.
* **HC-SMoE:** Median ~0.92. Lowest median in the group. Shows the highest variance (largest box and whiskers) and significant outliers reaching as low as ~0.25.
## 5. Key Technical Findings
1. **Positive Correlation:** As the **N-gram size** increases (from 2 to 4), the **N-gram diversity** generally increases for all models.
2. **Performance Hierarchy:** Across all N-gram sizes, the **Baseline** and **REAP** models consistently maintain the highest diversity scores with the lowest variance.
3. **Model Stability:** The **HC-SMoE** model (Olive) consistently exhibits the lowest median diversity and the highest variance/instability, as evidenced by the larger box sizes and the high density of low-value outliers.
4. **Outlier Behavior:** All models show a "bottom-heavy" outlier distribution, indicating that while they usually achieve high diversity, there are specific instances where diversity drops significantly, particularly for the SMoE variants.