## Box Plot Comparison: N-gram Diversity
### Overview
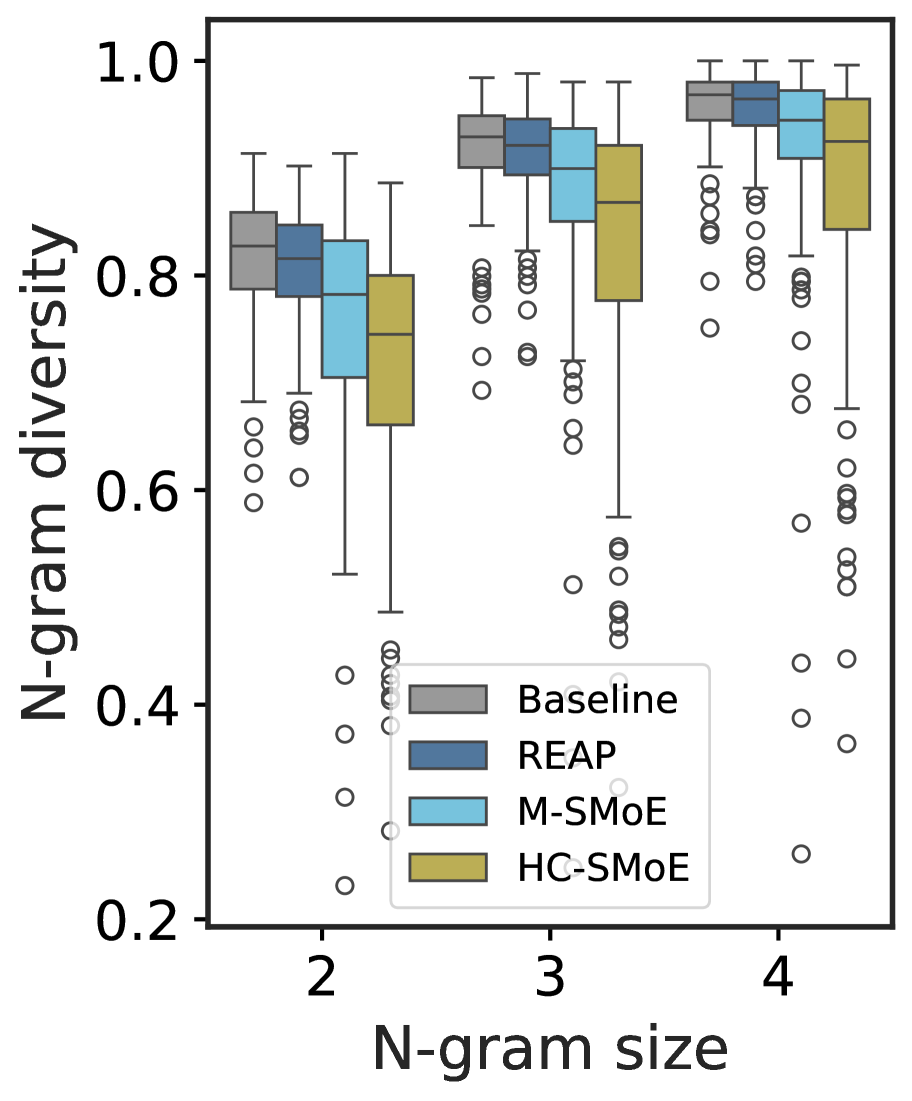
The image displays a box plot comparison of N-gram diversity across different N-gram sizes (2, 3, and 4). The plot is divided into three groups, each representing a different method of calculating N-gram diversity: Baseline, REAP, M-SMoE, and HC-SMoE.
### Components/Axes
- **X-axis (Horizontal)**: Represents the N-gram size, with values ranging from 2 to 4.
- **Y-axis (Vertical)**: Represents the N-gram diversity, with values ranging from 0.2 to 1.0.
- **Legend**: Located at the bottom right, it provides color coding for each method.
- **Gray**: Baseline
- **Blue**: REAP
- **Light Blue**: M-SMoE
- **Yellow**: HC-SMoE
### Detailed Analysis or ### Content Details
- **Baseline**: The box plot for the Baseline method shows a relatively stable N-gram diversity across all N-gram sizes, with a median value slightly above 0.5.
- **REAP**: The REAP method exhibits a higher median N-gram diversity compared to the Baseline, with values consistently above 0.5.
- **M-SMoE**: The M-SMoE method shows a moderate N-gram diversity, with values slightly above 0.5.
- **HC-SMoE**: The HC-SMoE method has the highest N-gram diversity, with values consistently above 0.5.
### Key Observations
- **Trend**: All methods show an increase in N-gram diversity as the N-gram size increases.
- **Outliers**: There are no significant outliers in any of the methods.
- **Variability**: The variability in N-gram diversity is highest for the HC-SMoE method, indicating more fluctuation in diversity across different N-gram sizes.
### Interpretation
The data suggests that the HC-SMoE method consistently results in the highest N-gram diversity across all N-gram sizes, indicating a more diverse set of N-grams. The REAP method also shows a high level of diversity, but slightly lower than HC-SMoE. The Baseline and M-SMoE methods have similar levels of diversity, with the Baseline being slightly lower. The trend of increasing diversity with N-gram size is consistent across all methods. The high variability in the HC-SMoE method may indicate that it is more sensitive to changes in the data, leading to more diverse N-grams.