\n
## Diagram: State Transition/Circular Process
### Overview
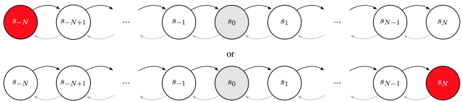
The image depicts two variations of a circular process or state transition diagram. Both diagrams show a series of interconnected nodes represented by circles, with arrows indicating the direction of flow. The key difference between the two diagrams is the initial and final state, highlighted in red.
### Components/Axes
The diagram consists of the following components:
* **Nodes:** Represented by circles labeled with terms like δ<sub>0</sub>, δ<sub>1</sub>, δ<sub>-N</sub>, and δ<sub>N</sub>. The ellipses "..." indicate that the sequence continues beyond the explicitly shown nodes.
* **Arrows:** Curved arrows connecting the nodes, indicating the direction of the process flow.
* **Highlighted Node:** A node colored red, representing either the starting or ending state of the process.
* **Gray Node:** A node colored gray, representing a state within the process.
* **Text:** The word "OR" separates the two diagrams.
### Detailed Analysis or Content Details
**Diagram 1 (Top):**
* The process begins with a red node labeled δ<sub>-N</sub> (bottom-left).
* The flow proceeds clockwise through a series of nodes labeled δ<sub>-N+1</sub>, δ<sub>0</sub>, δ<sub>1</sub>, and continues with "..." indicating further nodes.
* The process ends with a red node labeled δ<sub>N</sub> (top-right).
**Diagram 2 (Bottom):**
* The process begins with a node labeled δ<sub>-N+1</sub>.
* The flow proceeds clockwise through a series of nodes labeled δ<sub>0</sub>, δ<sub>1</sub>, and continues with "..." indicating further nodes.
* The process ends with a red node labeled δ<sub>N</sub> (bottom-right).
### Key Observations
* Both diagrams represent a cyclical process.
* The only difference is the starting point of the cycle.
* The gray node δ<sub>0</sub> appears in both diagrams, suggesting it's a significant state within the process.
* The red nodes δ<sub>-N</sub> and δ<sub>N</sub> represent the beginning and end points, respectively, but their positions are swapped between the two diagrams.
### Interpretation
The diagram illustrates two possible pathways through a cyclical process. The use of δ<sub>-N</sub> and δ<sub>N</sub> suggests a process involving some form of negation or inverse operation. The "OR" between the diagrams indicates that either pathway is valid, or that the process can start from either δ<sub>-N</sub> or δ<sub>-N+1</sub>. The gray node δ<sub>0</sub> could represent a stable state or a critical point in the process. The cyclical nature of the diagram suggests a repeating or iterative process. Without further context, it's difficult to determine the specific meaning of the process, but it likely represents a system with feedback loops or a state machine with defined transitions. The diagram is abstract and does not provide specific numerical data, but rather a conceptual representation of a process flow.