## Diagram & Bar Chart: Model Performance with 4-Token Prediction
### Overview
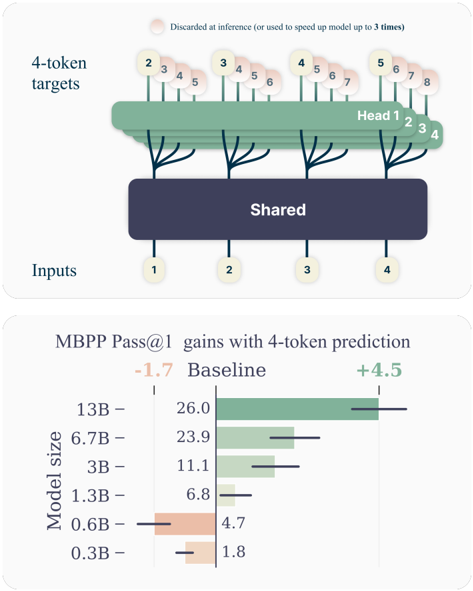
The image presents a diagram illustrating a model architecture with 4-token targets and a subsequent bar chart showing the gains in MBPP Pass@1 performance with 4-token prediction across different model sizes. The diagram depicts an input layer feeding into a shared layer, which then branches out into multiple "Heads" processing 4-token targets. The bar chart compares the performance of models of varying sizes against a baseline.
### Components/Axes
**Diagram:**
* **Inputs:** Labeled with numbers 1 through 4, representing the input data.
* **Shared:** A dark blue rectangular block representing a shared layer in the model.
* **Head 1, Head 2, Head 3, Head 4:** Green leaf-like structures representing the heads of the model.
* **4-token targets:** Labeled at the top, with numbers 1 through 8 indicating the token positions.
* **Discarded at inference:** A light orange bubble with text "Discarded at inference (or used to speed up model up to 3 times)".
**Bar Chart:**
* **Y-axis:** "Model size" with values: 0.3B, 0.6B, 1.3B, 3B, 6.7B, 13B.
* **X-axis:** "MBPP Pass@1 gains with 4-token prediction" ranging from approximately -1.7 to +4.5.
* **Baseline:** A vertical line at 0, indicating the baseline performance.
* **Color Coding:** Green bars represent positive gains, while orange bars represent negative gains.
### Detailed Analysis or Content Details
**Diagram:**
The diagram shows a model architecture where inputs (1-4) are processed through a "Shared" layer. This shared layer then feeds into four separate "Heads". Each head processes a sequence of 4 tokens (indicated by the "4-token targets" label and the numbers 1-8 above the heads). The orange bubble indicates that some information is discarded during inference, potentially to speed up the model.
**Bar Chart:**
* **0.3B:** Approximately 1.8 MBPP Pass@1 gain (orange bar).
* **0.6B:** Approximately 4.7 MBPP Pass@1 gain (orange bar).
* **1.3B:** Approximately 6.8 MBPP Pass@1 gain (green bar).
* **3B:** Approximately 11.1 MBPP Pass@1 gain (green bar).
* **6.7B:** Approximately 23.9 MBPP Pass@1 gain (green bar).
* **13B:** Approximately 26.0 MBPP Pass@1 gain (green bar).
The bars are horizontally aligned with their corresponding model size on the Y-axis. The length of each bar represents the MBPP Pass@1 gain relative to the baseline.
### Key Observations
* Smaller models (0.3B and 0.6B) show negative gains compared to the baseline.
* Models with 1.3B parameters and above demonstrate positive gains.
* The gains increase with model size, but the rate of increase appears to diminish as the model gets larger (the difference between 6.7B and 13B is smaller than the difference between 3B and 6.7B).
* The largest model (13B) achieves the highest gain, approximately 26.0.
### Interpretation
The data suggests that using 4-token prediction improves performance for larger language models (1.3B parameters and above) on the MBPP benchmark. However, for very small models (0.3B and 0.6B), the 4-token prediction approach actually *decreases* performance. This could be due to the increased complexity of processing 4 tokens outweighing the benefits for models with limited capacity.
The diagram illustrates a model architecture designed to leverage the benefits of 4-token prediction. The shared layer likely captures general features, while the individual heads specialize in processing the 4-token sequences. The discarding of information at inference suggests a trade-off between accuracy and speed.
The diminishing returns in gains as model size increases indicate that there may be a point of saturation where adding more parameters does not significantly improve performance with this 4-token prediction method. Further investigation would be needed to determine the optimal model size and the reasons for the negative gains in smaller models.