## Diagram Type: Flowchart
### Overview
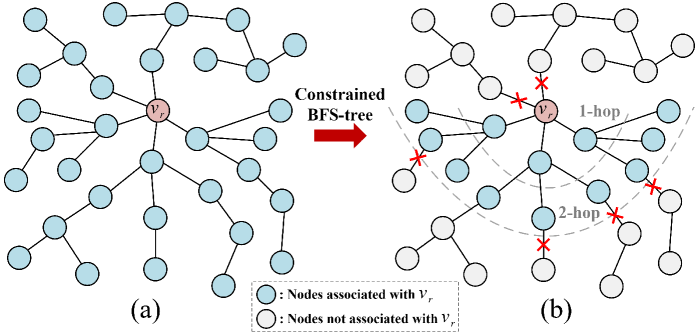
The image depicts a flowchart illustrating the process of constrained BFS-tree construction. It shows two stages: (a) the initial BFS-tree and (b) the constrained BFS-tree after applying certain constraints.
### Components/Axes
- **Nodes**: Represented by circles, some are colored blue and others are white.
- **Edges**: Lines connecting the nodes.
- **Legend**: Located at the bottom right, indicating the color coding for nodes associated with \( V_r \) and those not associated with \( V_r \).
- **Annotations**: Red stars mark specific nodes in the constrained BFS-tree.
- **Axes**: No explicit axes are visible, but the flowchart is structured to show the progression from the initial to the constrained BFS-tree.
### Detailed Analysis or ### Content Details
- **Stage (a)**: The initial BFS-tree is shown with nodes spread out, indicating a full breadth-first search.
- **Stage (b)**: The constrained BFS-tree is shown with nodes that are not directly connected to \( V_r \) marked with red stars, indicating the application of constraints.
- **Nodes Associated with \( V_r \)**: These nodes are colored blue and are connected to \( V_r \) in the initial BFS-tree.
- **Nodes Not Associated with \( V_r \)**: These nodes are colored white and are not directly connected to \( V_r \) in the initial BFS-tree.
### Key Observations
- **1-hop and 2-hop**: The red stars indicate nodes that are 1-hop or 2-hop away from \( V_r \) in the constrained BFS-tree.
- **Constrained BFS-tree**: The process of constraining the BFS-tree to exclude nodes not associated with \( V_r \).
### Interpretation
The flowchart demonstrates the concept of constrained BFS-tree construction, where the initial BFS-tree is expanded to include nodes not directly connected to \( V_r \) under certain constraints. This process is likely used in network analysis or graph theory to identify specific nodes of interest within a network. The interpretation suggests that the constraints applied in the constrained BFS-tree are crucial for identifying nodes that are relevant to the study or analysis, while excluding those that are not. The visual representation helps in understanding the flow and the impact of the constraints on the network structure.