## Line Chart: Scaling up Test-Time Compute with Recurrent Depth
### Overview
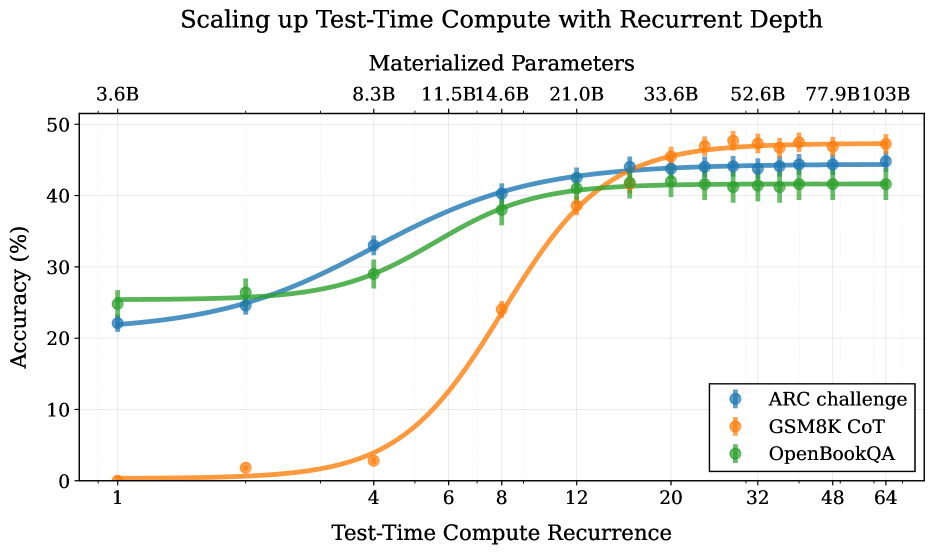
This is a line chart illustrating the relationship between "Test-Time Compute Recurrence" (x-axis) and model "Accuracy (%)" (y-axis) for three different benchmark tasks. The chart's primary title is "Scaling up Test-Time Compute with Recurrent Depth," with a subtitle "Materialized Parameters" indicating a secondary, correlated metric. The data suggests that increasing the recurrence of test-time computation generally improves accuracy across all tasks, though the rate and ceiling of improvement vary significantly.
### Components/Axes
* **Main Title:** "Scaling up Test-Time Compute with Recurrent Depth"
* **Subtitle:** "Materialized Parameters"
* **X-Axis (Primary):** "Test-Time Compute Recurrence". The axis is logarithmic, with labeled tick marks at values: 1, 4, 6, 8, 12, 20, 32, 48, 64.
* **Y-Axis:** "Accuracy (%)". The axis is linear, ranging from 0 to 50 with major tick marks every 10 units (0, 10, 20, 30, 40, 50).
* **Top Axis (Secondary):** "Materialized Parameters". This axis aligns with the primary x-axis ticks and shows corresponding parameter counts: 3.6B, 8.3B, 11.5B, 14.6B, 21.0B, 33.6B, 52.6B, 77.9B, 103B.
* **Legend:** Located in the bottom-right corner of the plot area. It contains three entries:
* Blue circle with line: "ARC challenge"
* Orange circle with line: "GSM8K CoT"
* Green circle with line: "OpenBookQA"
### Detailed Analysis
The chart plots three data series, each with error bars (vertical lines through data points) indicating variability. The approximate data points, read from the chart, are as follows:
**1. ARC challenge (Blue Line):**
* **Trend:** Shows a steady, concave-down increase that begins to plateau at higher recurrence values.
* **Data Points (Recurrence, Accuracy %):**
* (1, ~22)
* (4, ~33)
* (8, ~40)
* (12, ~43)
* (20, ~44)
* (32, ~44)
* (48, ~44)
* (64, ~44)
**2. GSM8K CoT (Orange Line):**
* **Trend:** Exhibits a sigmoidal (S-shaped) growth pattern. Accuracy is near zero for low recurrence, then increases very rapidly between recurrence values of 4 and 12, before plateauing at the highest level among the three tasks.
* **Data Points (Recurrence, Accuracy %):**
* (1, ~0)
* (4, ~3)
* (8, ~24)
* (12, ~38)
* (20, ~46)
* (32, ~47)
* (48, ~47)
* (64, ~47)
**3. OpenBookQA (Green Line):**
* **Trend:** Shows a steady, nearly linear increase that plateaus earlier and at a lower accuracy level than the other two tasks.
* **Data Points (Recurrence, Accuracy %):**
* (1, ~25)
* (4, ~29)
* (8, ~38)
* (12, ~41)
* (20, ~41)
* (32, ~41)
* (48, ~41)
* (64, ~41)
**Materialized Parameters Correlation:**
The top axis shows that "Materialized Parameters" increase monotonically with "Test-Time Compute Recurrence." The growth is non-linear, accelerating at higher recurrence values (e.g., from 3.6B at recurrence=1 to 103B at recurrence=64).
### Key Observations
1. **Task-Dependent Scaling:** The benefit of increased test-time compute is highly task-dependent. GSM8K CoT (a math reasoning task) shows the most dramatic improvement, starting from near-zero and achieving the highest final accuracy. ARC challenge (a reasoning task) shows strong, steady gains. OpenBookQA (a knowledge-based QA task) shows the most modest gains and earliest plateau.
2. **Performance Plateaus:** All three tasks exhibit performance saturation. ARC challenge and OpenBookQA plateau around recurrence=20, while GSM8K CoT plateaus around recurrence=32. Further increases in compute yield negligible accuracy gains.
3. **Initial Performance Disparity:** At the lowest compute setting (recurrence=1), there is a large gap in baseline accuracy: OpenBookQA (~25%) > ARC challenge (~22%) >> GSM8K CoT (~0%).
4. **Compute-Accuracy Trade-off:** The chart visualizes a clear trade-off: higher accuracy requires exponentially more materialized parameters (compute). The final accuracy gains from recurrence=20 to 64 are minimal, but the parameter count more than triples (from 33.6B to 103B).
### Interpretation
This chart demonstrates the principle of "test-time compute scaling" for recurrent depth models. It provides empirical evidence that allocating more computational steps (recurrence) during inference can significantly boost model performance on complex reasoning tasks, but with diminishing returns.
The data suggests that tasks requiring multi-step reasoning (like GSM8K CoT) benefit most profoundly from this technique, as they can leverage the additional compute to perform more "mental steps." In contrast, tasks relying more on stored knowledge (OpenBookQA) see less benefit, as their performance is likely bottlenecked by the model's parametric knowledge rather than its reasoning depth.
The "Materialized Parameters" axis is crucial for interpretation. It quantifies the cost of scaling test-time compute. The exponential growth of parameters with recurrence highlights the significant computational overhead involved. The plateau in accuracy indicates a point of inefficiency where additional compute no longer translates to meaningful performance gains, defining an optimal operating point for resource allocation. This chart is therefore a tool for understanding the cost-benefit landscape of scaling inference compute for different types of cognitive tasks.