## Line Chart: Surprisal vs. Training Steps
### Overview
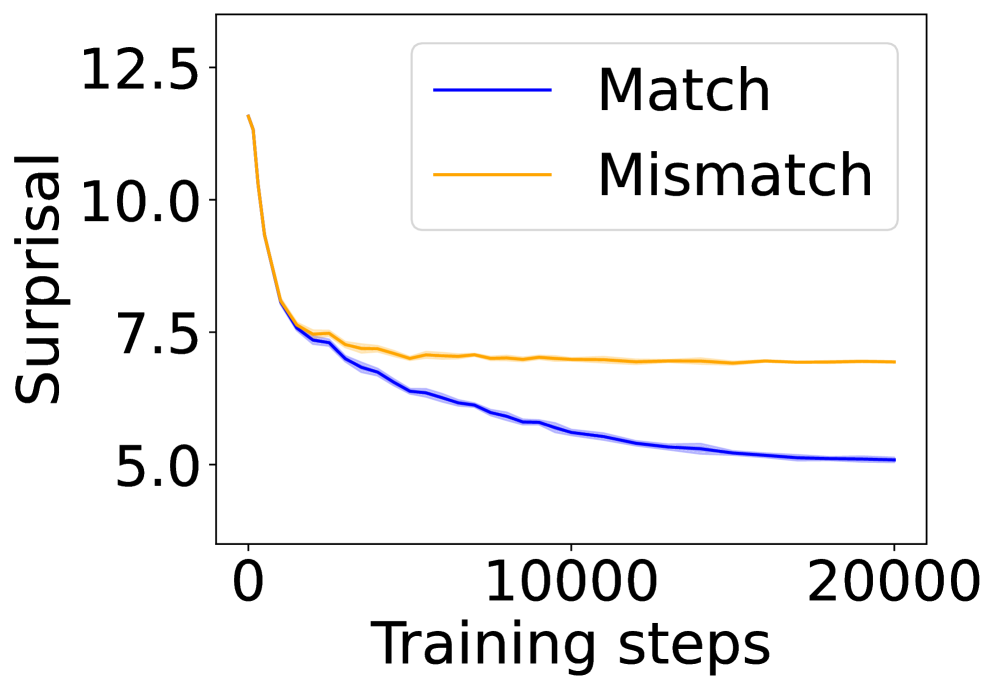
The image is a line chart comparing the "Surprisal" of two conditions, "Match" and "Mismatch," over a range of "Training steps." The chart displays how surprisal changes as the number of training steps increases.
### Components/Axes
* **X-axis:** "Training steps," ranging from 0 to 20000 in increments of 10000.
* **Y-axis:** "Surprisal," ranging from 5.0 to 12.5 in increments of 2.5.
* **Legend:** Located in the top-right corner.
* Blue line: "Match"
* Orange line: "Mismatch"
### Detailed Analysis
* **Match (Blue Line):**
* Trend: The "Match" line shows a decreasing trend.
* Data Points:
* At 0 training steps, surprisal is approximately 8.0.
* At 10000 training steps, surprisal is approximately 6.0.
* At 20000 training steps, surprisal is approximately 5.0.
* **Mismatch (Orange Line):**
* Trend: The "Mismatch" line also shows a decreasing trend initially, but plateaus after approximately 5000 training steps.
* Data Points:
* At 0 training steps, surprisal is approximately 12.0.
* At 10000 training steps, surprisal is approximately 7.2.
* At 20000 training steps, surprisal is approximately 7.0.
### Key Observations
* Both "Match" and "Mismatch" conditions exhibit a decrease in surprisal as training steps increase, indicating learning.
* The "Mismatch" condition starts with a higher surprisal than the "Match" condition.
* The "Mismatch" condition plateaus at a higher surprisal level compared to the "Match" condition.
* The blue and orange lines have a shaded area around them, indicating a confidence interval or standard deviation.
### Interpretation
The chart suggests that the model finds "Mismatch" conditions more surprising initially, but learns to handle them as training progresses. However, even after substantial training, the model remains more surprised by "Mismatch" conditions than "Match" conditions. This could indicate that the model is better at predicting or processing "Match" conditions, or that "Mismatch" conditions inherently contain more uncertainty or complexity. The confidence intervals provide an indication of the variability in the surprisal values across different runs or data samples.