## Line Graph: Surprisal vs. Training Steps
### Overview
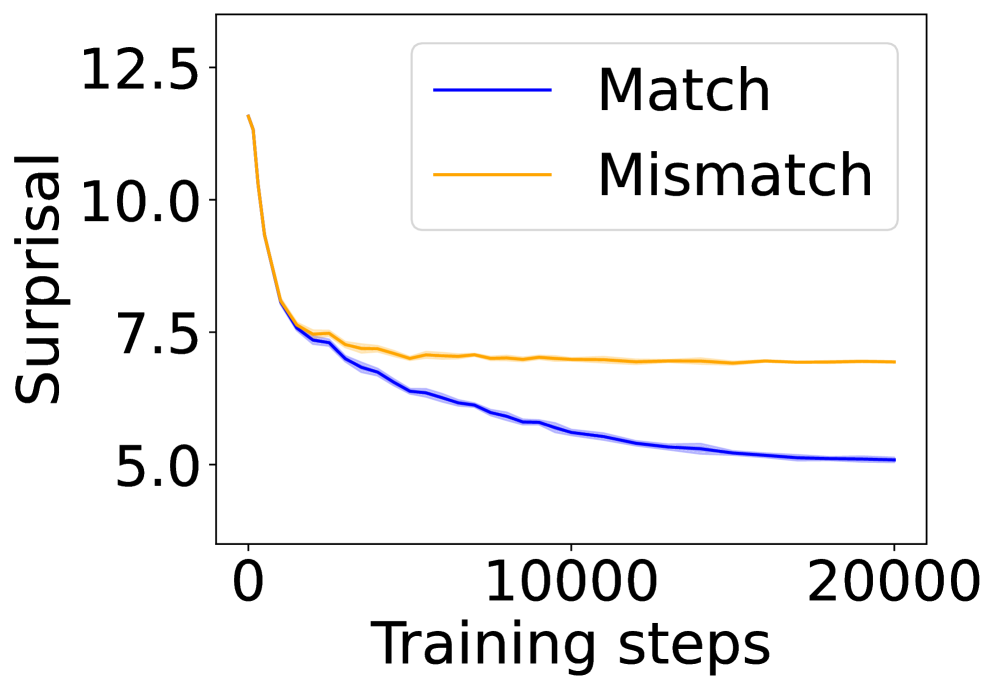
The image depicts a line graph comparing the relationship between "Training steps" (x-axis) and "Surprisal" (y-axis) for two scenarios: "Match" (blue line) and "Mismatch" (orange line). Both lines show a declining trend in surprisal values as training steps increase, with distinct initial trajectories and eventual convergence.
### Components/Axes
- **Y-axis (Surprisal)**: Labeled "Surprisal," scaled from 5.0 to 12.5 in increments of 2.5.
- **X-axis (Training steps)**: Labeled "Training steps," scaled from 0 to 20,000 in increments of 10,000.
- **Legend**: Positioned in the top-right corner, with:
- Blue line: "Match"
- Orange line: "Mismatch"
### Detailed Analysis
1. **Match (Blue Line)**:
- Starts at **~12.5** surprisal at 0 training steps.
- Declines sharply to **~7.5** by ~5,000 steps.
- Continues a gradual decline to **~5.0** by 20,000 steps.
- Shaded area around the line suggests uncertainty, narrowing as training progresses.
2. **Mismatch (Orange Line)**:
- Starts at **~10.0** surprisal at 0 training steps.
- Declines to **~7.5** by ~5,000 steps.
- Remains relatively flat at **~7.5** from ~10,000 to 20,000 steps.
- Shaded area is narrower than the Match line, indicating lower uncertainty.
### Key Observations
- Both lines exhibit a **steep initial decline** in surprisal, followed by a plateau.
- The Match line shows a **more pronounced early drop** compared to Mismatch.
- By 20,000 steps, both lines converge near **~5.0–7.5** surprisal, suggesting similar performance in later training stages.
- The Mismatch line demonstrates **lower initial surprisal** but slower adaptation than Match.
### Interpretation
The data suggests that both Match and Mismatch scenarios reduce surprisal (i.e., become more predictable) as training progresses. The Match scenario starts with higher surprisal, indicating it may represent a more complex or unexpected task initially. The convergence of the lines implies that after sufficient training (10,000+ steps), the model’s ability to handle both scenarios becomes comparable. The narrower uncertainty bands for Mismatch suggest more stable learning dynamics in that scenario. The sharp early decline for Match could reflect rapid adaptation to a novel pattern, while the plateau for Mismatch might indicate a ceiling effect or inherent stability in mismatched data.