## Line Chart: Benchmark: MATH500
### Overview
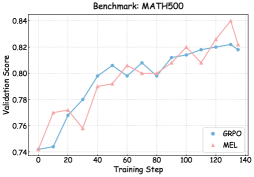
The image displays a line chart comparing the validation score performance of two methods, GRPO and MEL, over the course of training steps on the MATH500 benchmark. The chart shows both methods exhibit an overall upward trend, indicating learning and improvement, with significant fluctuations and crossovers between the two lines.
### Components/Axes
* **Chart Title:** "Benchmark: MATH500" (centered at the top).
* **Y-Axis:** Labeled "Validation Score". The scale runs from 0.74 to 0.84, with major tick marks at intervals of 0.02 (0.74, 0.76, 0.78, 0.80, 0.82, 0.84).
* **X-Axis:** Labeled "Training Step". The scale runs from 0 to 140, with major tick marks at intervals of 20 (0, 20, 40, 60, 80, 100, 120, 140).
* **Legend:** Located in the bottom-right corner of the plot area.
* **GRPO:** Represented by a blue line with circular markers.
* **MEL:** Represented by a red line with triangular markers.
### Detailed Analysis
**Data Series Trends & Approximate Points:**
1. **GRPO (Blue Line, Circle Markers):**
* **Trend:** Shows a generally steady upward climb with moderate fluctuations. It starts lower than MEL, overtakes it around step 40, and ends slightly below its final peak.
* **Key Data Points (Approximate):**
* Step 0: ~0.74
* Step 20: ~0.78
* Step 40: ~0.80
* Step 60: ~0.795 (slight dip)
* Step 80: ~0.80
* Step 100: ~0.82
* Step 120: ~0.825
* Step 140: ~0.82
2. **MEL (Red Line, Triangle Markers):**
* **Trend:** Shows a more volatile upward trend with sharper peaks and valleys. It starts higher, dips significantly at step 20, recovers, and achieves the highest overall score on the chart before a final dip.
* **Key Data Points (Approximate):**
* Step 0: ~0.76
* Step 20: ~0.76 (dip)
* Step 40: ~0.80
* Step 60: ~0.81
* Step 80: ~0.80 (dip)
* Step 100: ~0.815
* Step 120: ~0.84 (peak)
* Step 140: ~0.83
**Spatial & Cross-Reference Check:**
* The legend is positioned in the bottom-right, not obscuring the main data trends.
* The blue line (GRPO) is consistently plotted with circle markers, and the red line (MEL) with triangle markers, matching the legend exactly.
* The lines intersect approximately at step 40 (both ~0.80) and again near step 100 (both ~0.815-0.82).
### Key Observations
1. **Overall Improvement:** Both GRPO and MEL show a clear positive correlation between training steps and validation score, indicating successful learning on the MATH500 benchmark.
2. **Performance Crossover:** GRPO starts with a lower score but catches up to and briefly surpasses MEL around step 40.
3. **Volatility vs. Stability:** MEL demonstrates higher volatility, achieving the highest peak score (~0.84 at step 120) but also suffering sharper dips (e.g., at step 20). GRPO's progression appears somewhat smoother in the latter half.
4. **Final Convergence:** By the final recorded step (140), the two methods have converged to a very similar performance level (GRPO ~0.82, MEL ~0.83), with MEL retaining a slight edge.
### Interpretation
The chart suggests that for the MATH500 benchmark, both the GRPO and MEL training methods are effective, as evidenced by the rising validation scores. The choice between them may involve a trade-off: **MEL** appears capable of reaching a higher maximum performance (a peak of ~0.84) but exhibits less stability during training, which could imply sensitivity to specific training batches or hyperparameters. **GRPO** shows a more consistent, if slightly less spectacular, improvement trajectory, which might be preferable for reliability.
The convergence of scores at the end could indicate that both methods are approaching a performance ceiling for this specific model architecture and dataset. The initial underperformance and subsequent catch-up by GRPO might reflect different learning dynamics or initialization states. A practitioner might investigate the cause of MEL's significant dip at step 20 to understand potential failure modes. Ultimately, the data demonstrates that meaningful progress on this benchmark is achievable within 140 training steps using either method.