\n
## Scatter Plot: Confidence vs. Target Length (High School Psychology)
### Overview
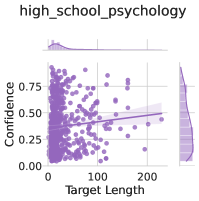
The image presents a scatter plot visualizing the relationship between "Target Length" and "Confidence" for data labeled as "high_school_psychology". The plot includes a regression line with a shaded confidence interval. Marginal histograms are displayed above and to the right of the main scatter plot, showing the distributions of "Target Length" and "Confidence" respectively.
### Components/Axes
* **X-axis:** "Target Length" - Scale ranges from approximately 0 to 220.
* **Y-axis:** "Confidence" - Scale ranges from approximately 0.00 to 0.75.
* **Data Points:** Numerous purple dots representing individual data points.
* **Regression Line:** A dark purple line representing the trend of the data. The line slopes downward slightly.
* **Confidence Interval:** A light purple shaded area around the regression line, indicating the uncertainty in the estimated trend.
* **Marginal Histogram (Top):** Displays the distribution of "Target Length". It appears to be a right-skewed distribution, with a peak around a value of 0.
* **Marginal Histogram (Right):** Displays the distribution of "Confidence". It appears to be a bimodal distribution, with peaks around 0.25 and 0.75.
* **Title:** "high\_school\_psychology" - positioned at the top-center of the image.
### Detailed Analysis
The scatter plot shows a weak negative correlation between "Target Length" and "Confidence". As "Target Length" increases, "Confidence" tends to decrease, but the relationship is not strong.
* **Data Point Distribution:** The majority of data points are clustered in the lower-left portion of the plot, where "Target Length" is less than 100 and "Confidence" is less than 0.5. There is a sparse scattering of points with higher "Target Length" values (between 100 and 220) and varying "Confidence" levels.
* **Regression Line:** The regression line has a negative slope, indicating a tendency for "Confidence" to decrease as "Target Length" increases. The slope appears to be relatively small.
* **Confidence Interval:** The confidence interval is relatively wide, suggesting a high degree of uncertainty in the estimated regression line.
* **Marginal Histograms:**
* The "Target Length" histogram shows a concentration of values near 0, with a tail extending to higher values.
* The "Confidence" histogram shows two peaks, one around 0.25 and another around 0.75, suggesting that "Confidence" values tend to cluster around these two levels.
### Key Observations
* The relationship between "Target Length" and "Confidence" is weak and negative.
* There is a significant amount of variability in "Confidence" for a given "Target Length".
* The marginal histograms reveal the distributions of "Target Length" and "Confidence", which are both non-normal.
* The bimodal distribution of "Confidence" suggests that there may be two distinct groups or factors influencing "Confidence" levels.
### Interpretation
The data suggests that, within the context of "high_school_psychology", there is a slight tendency for confidence to decrease as the target length increases. However, this relationship is not strong, and other factors likely play a more significant role in determining confidence levels. The bimodal distribution of confidence suggests that there might be two different underlying processes or groups influencing confidence. The right-skewed distribution of target length indicates that most targets are relatively short, with a few longer targets. The wide confidence interval around the regression line indicates that the observed relationship is not very precise and could be due to chance. Further investigation would be needed to understand the underlying reasons for these patterns and to identify the factors that are most strongly associated with confidence.